The Stellar Actinide Boost andr -Process Implications
Good morning everyone, and thanks for being here.
Today I will introduce some work that is a part of my thesis about actinides in metal-poor stars and their implication for r-process nucleosynthesis
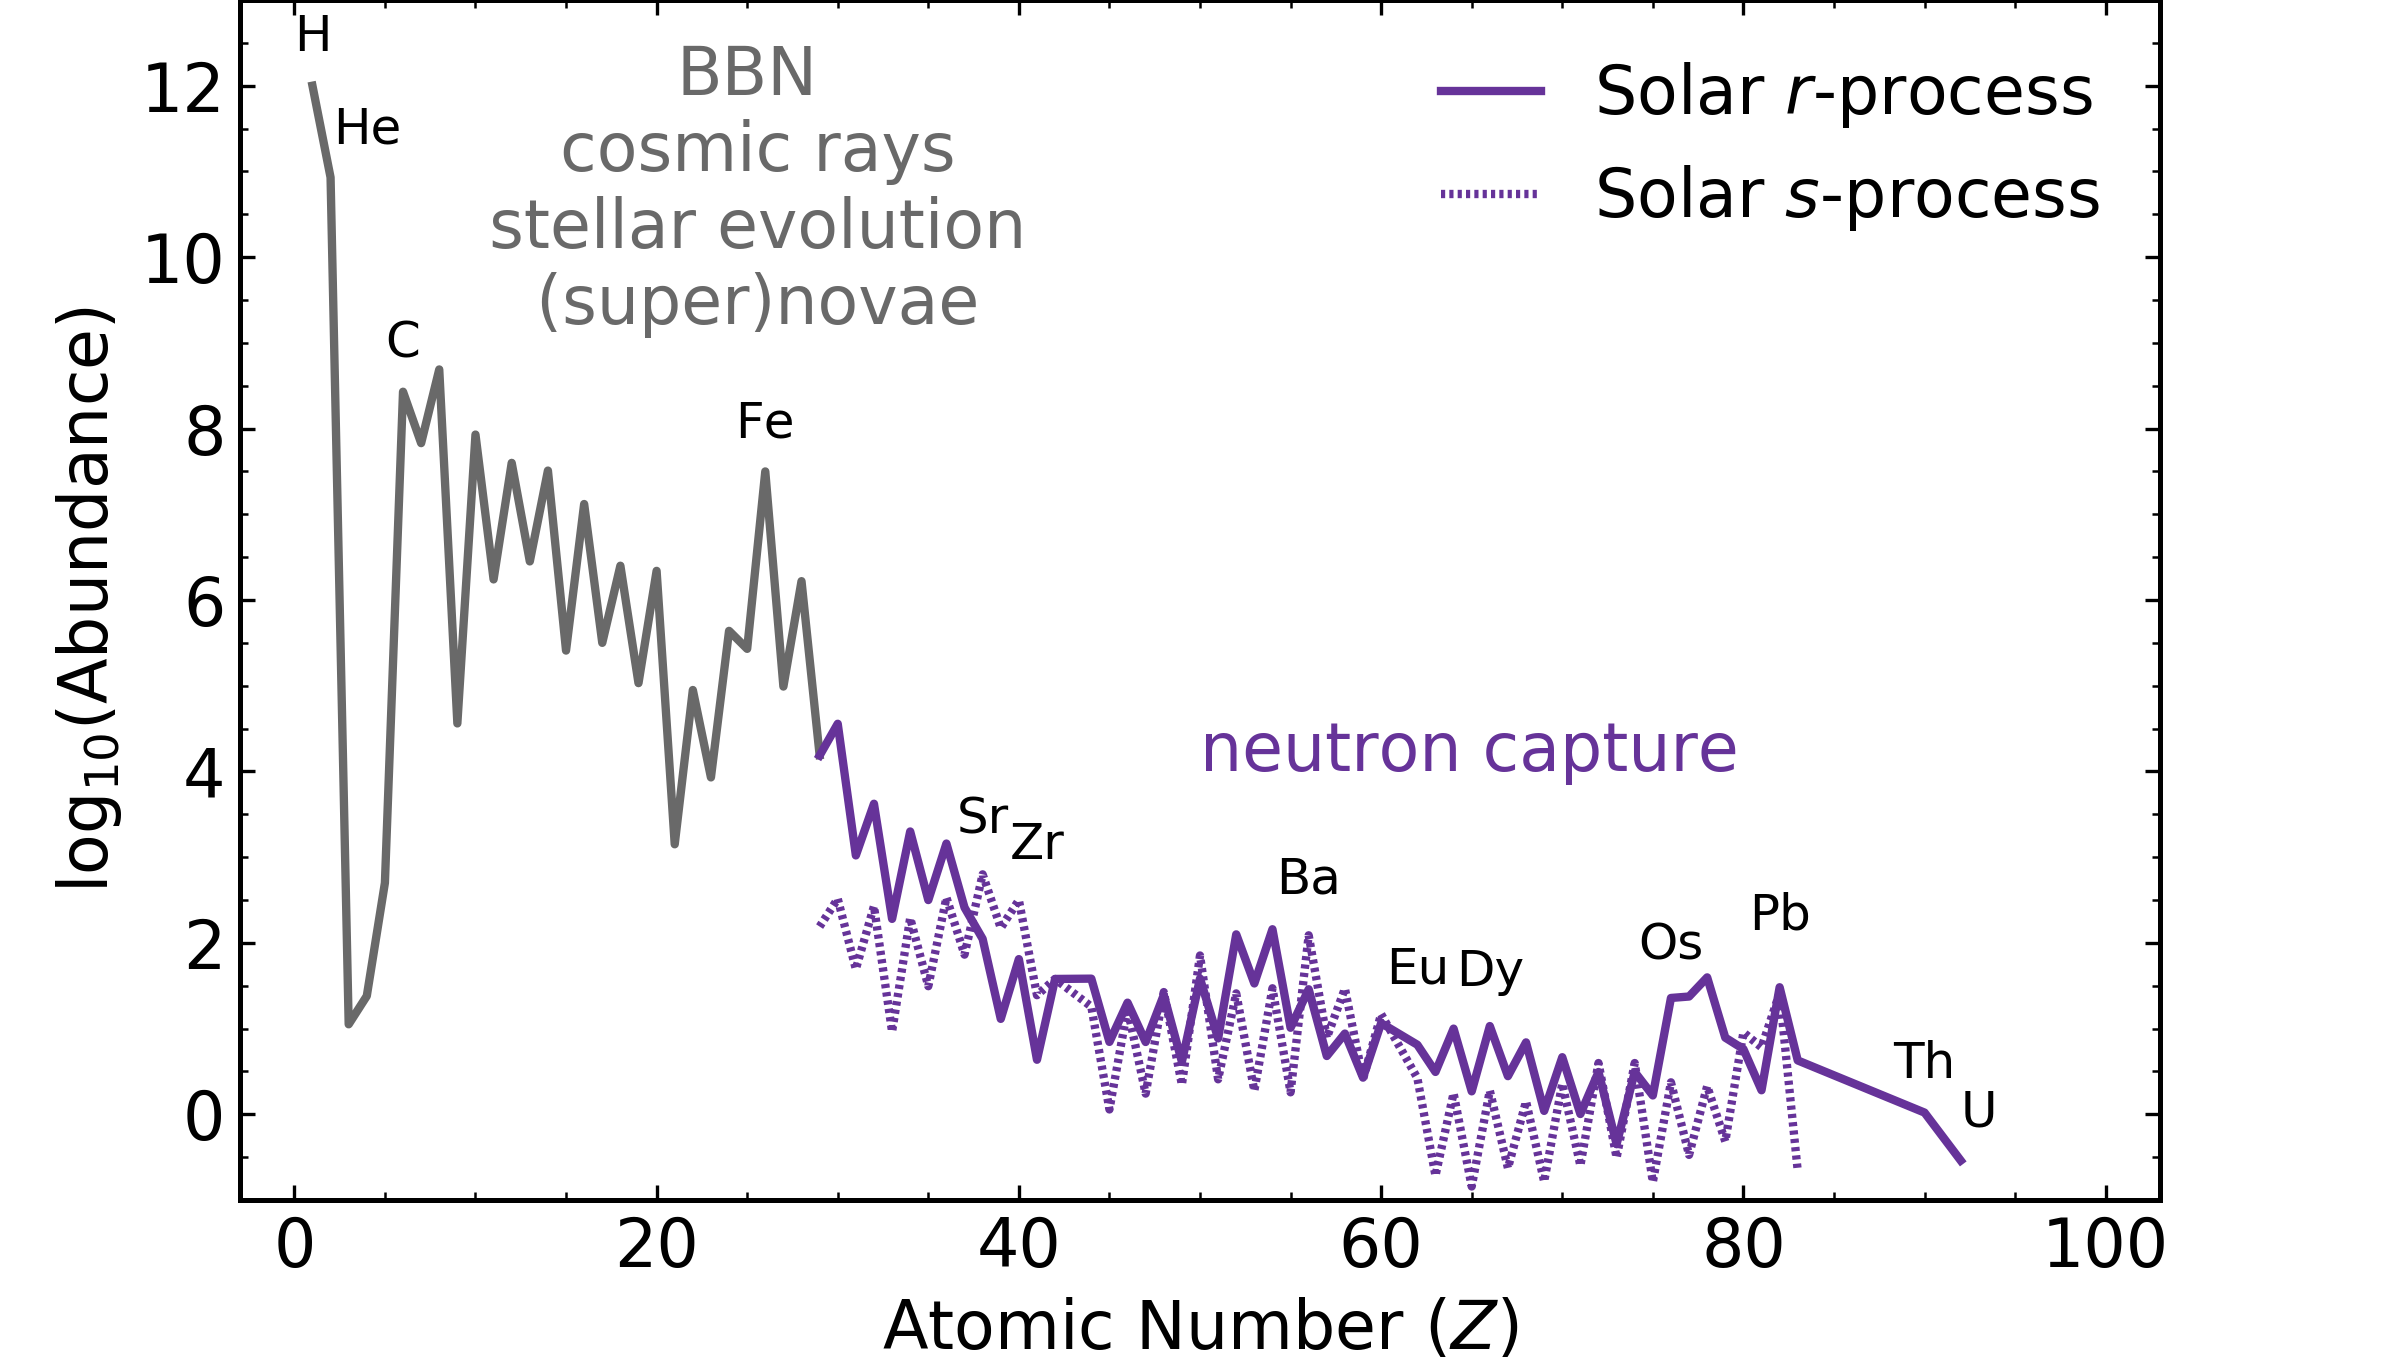
Elements in the Universe
from data in Sneden+ (2008)
Here on Earth and in the Solar System, we find a full range of elements from the light elements created in the Big Bang to the actinides, Th and U.
We think we have a very good idea how most of the elements through iron were made: many by stars through fusion explosive events.
To create most of the heavy elements requires neutron-capture processes.
Specificially, the slow neutron capture process (or s-process), where the timescale to capture neutrons is slower than beta decay; and rapid neutron capture (or r-process), where successive neutron captures occur before the nucleus beta-decays.
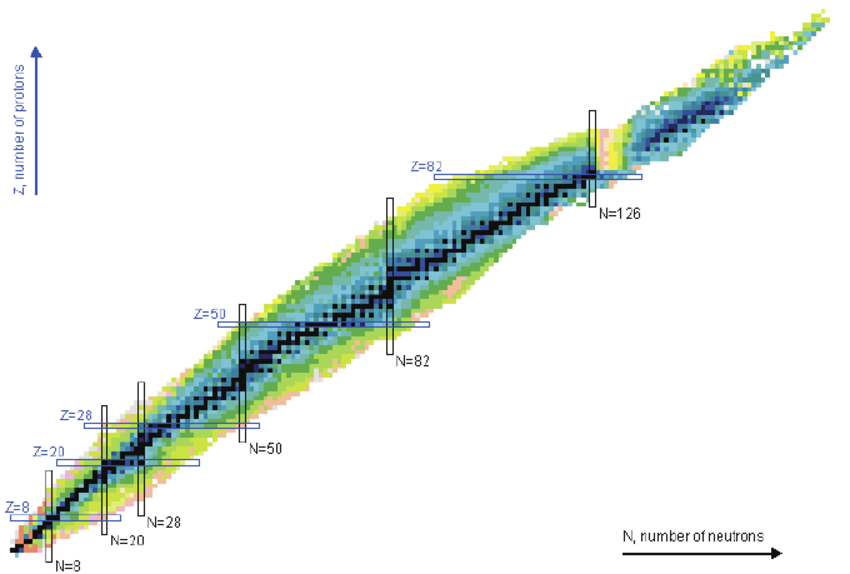
The Nuclear Physicist's Periodic Table
National Nuclear Data Center, Brookhaven National Laboratory
Before we dive into the details about neutron-capture, I would be remiss if I did not mention the chart of nuclides.
This is basically an expanded periodic table with element (or charge number) on the y-axis and neutron number on the x-axis, indicating the isotope.
Hydrogen is in this corner, and Th and U are up here.
The lower right are neutron-rich, and the upper left are proton rich.
Stability....decay...
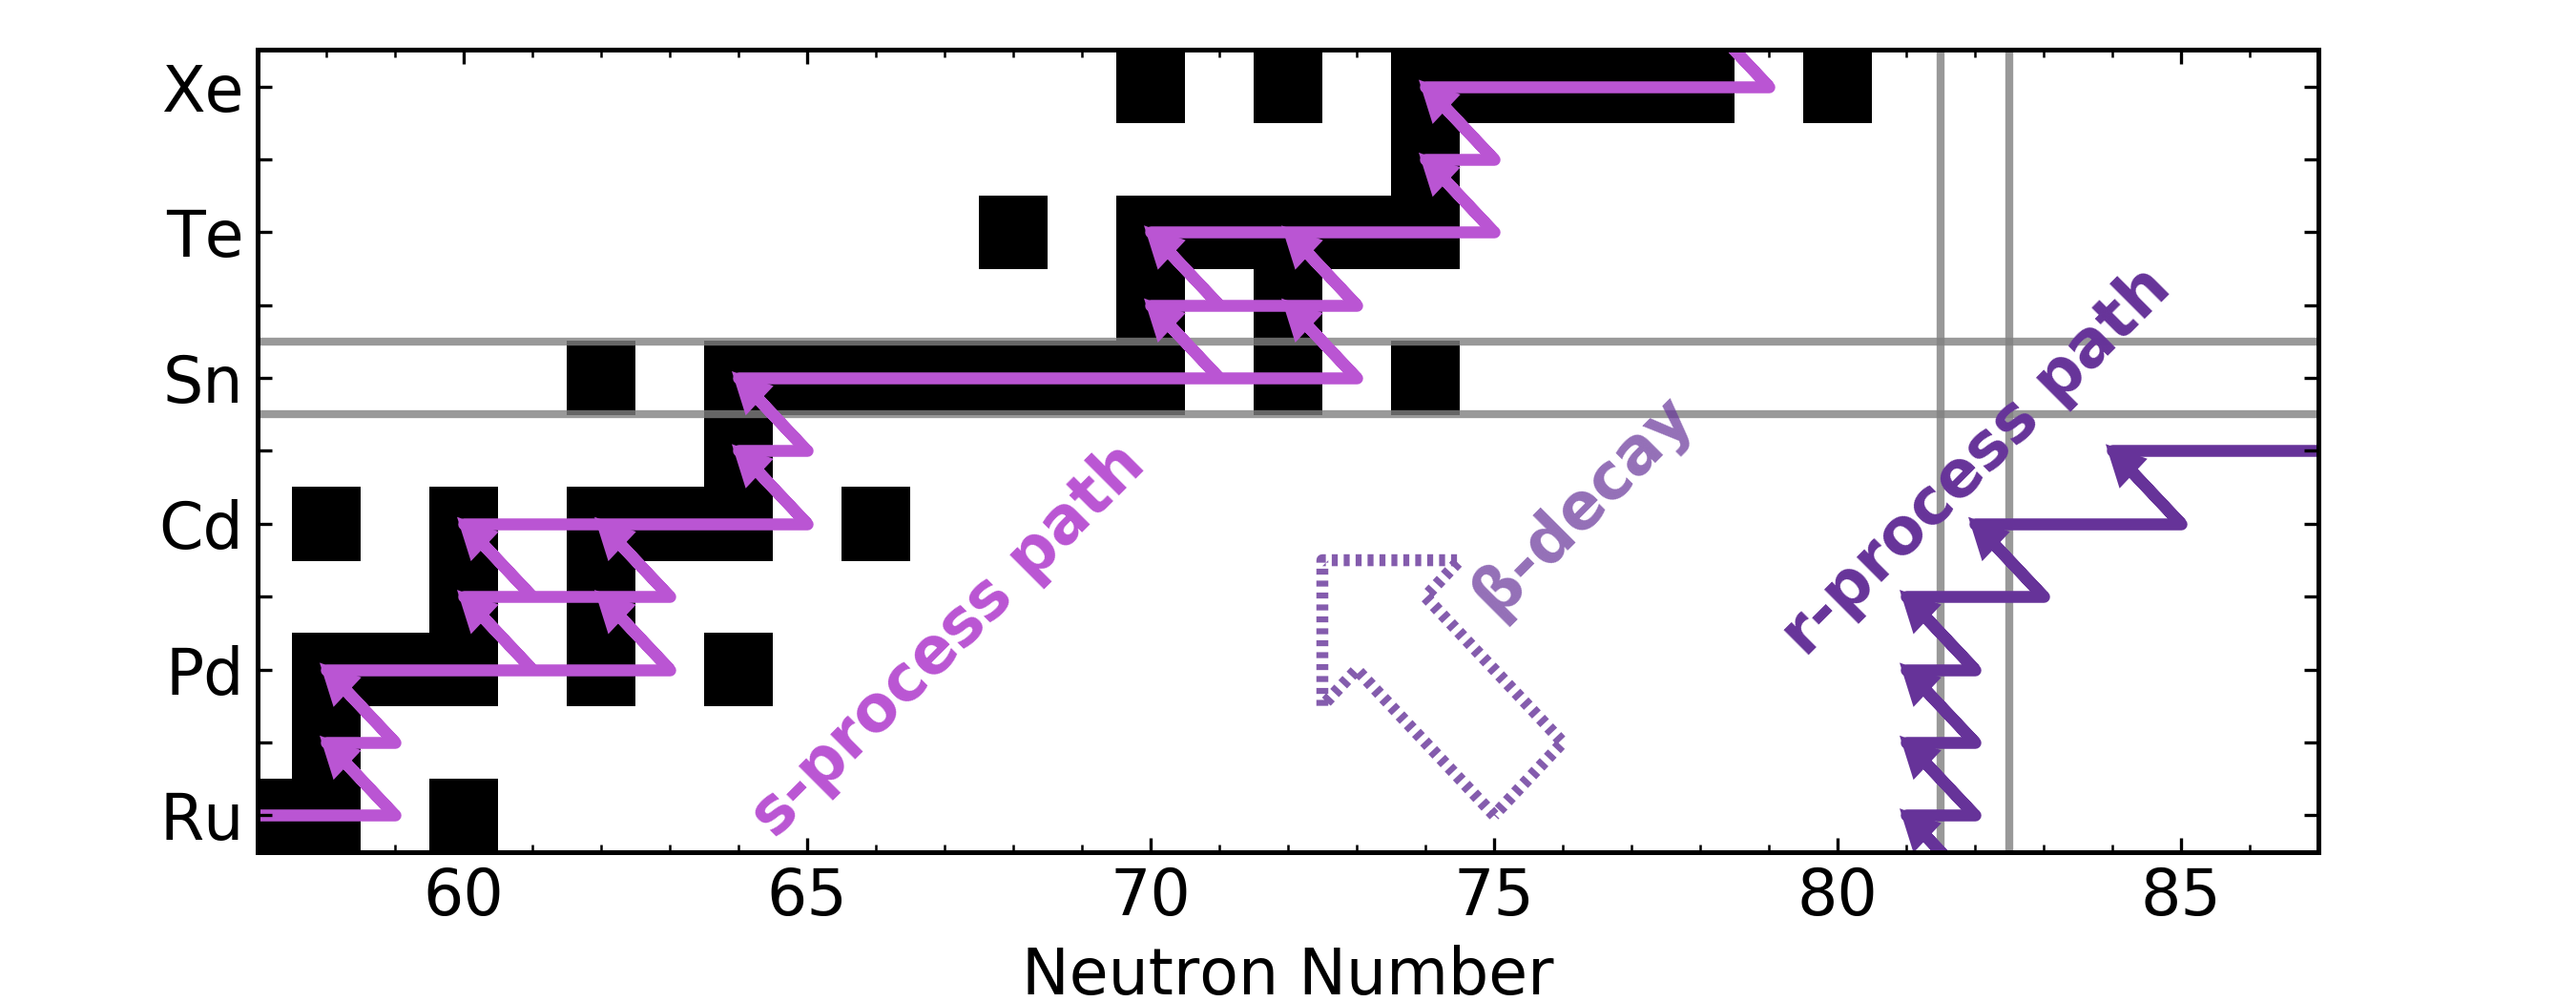
So let's zoom in on this chart and talk about neutron-capture.
Neutron capture
For n-capture, a nucleus will move towards the right on this chart.
Eventually, it will become unstable and undergo beta-decay, where the neutron turns into a proton.
When beta-decay happens, the nucleus moves to a higher charge number.
The slow neutron capture process (or s-process), where the timescale to capture neutrons is slower than beta decay; and rapid neutron capture (or r-process), where successive neutron captures occur before the nucleus beta-decays.
The net effect of the neutron capture timescale for the s- and r-processes is that the s-process takes place very close to stability, and the r-process very far from stability, and the nuclei tend to pile up at the closed neutron shells.
The slow neutron-capture process, or s-process, likely occurs in asymptotic giant branch stars during their normal evolution.
On the other hand, the rapid neutron-capture, or r-process, requires high neutron number densities, which cannot be attained during quiescent stellar burning, and indicates an explosive environment.
The r -process
This is a movie is a zoom-out showing how the r-process may proceed along the whole chart of nuclides.
Eventually, the neutron flux decreases, and the nuclei beta decay back to stability and form this r-process abundance pattern.
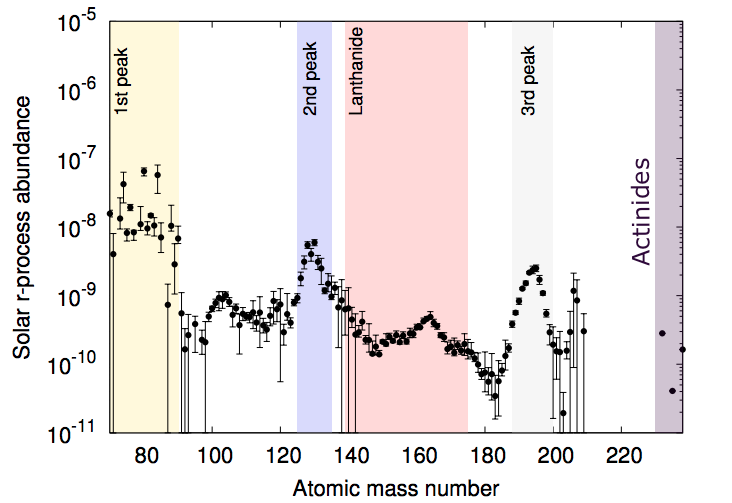
The r -Process Pattern
Hotokezaka+ (2018)
We have the three peaks that correspond to the closed neutron shells.
So we have a pretty good understanding of the nuclear physics in these processes.
What is the site of the r -Process?
Core-collapse supernovae? NASA / JPL-Caltech
Today, CCSNe are not supported by modern simulations as main r-process sources.
MHD-jet supernovae? NASA / SkyWork Digital
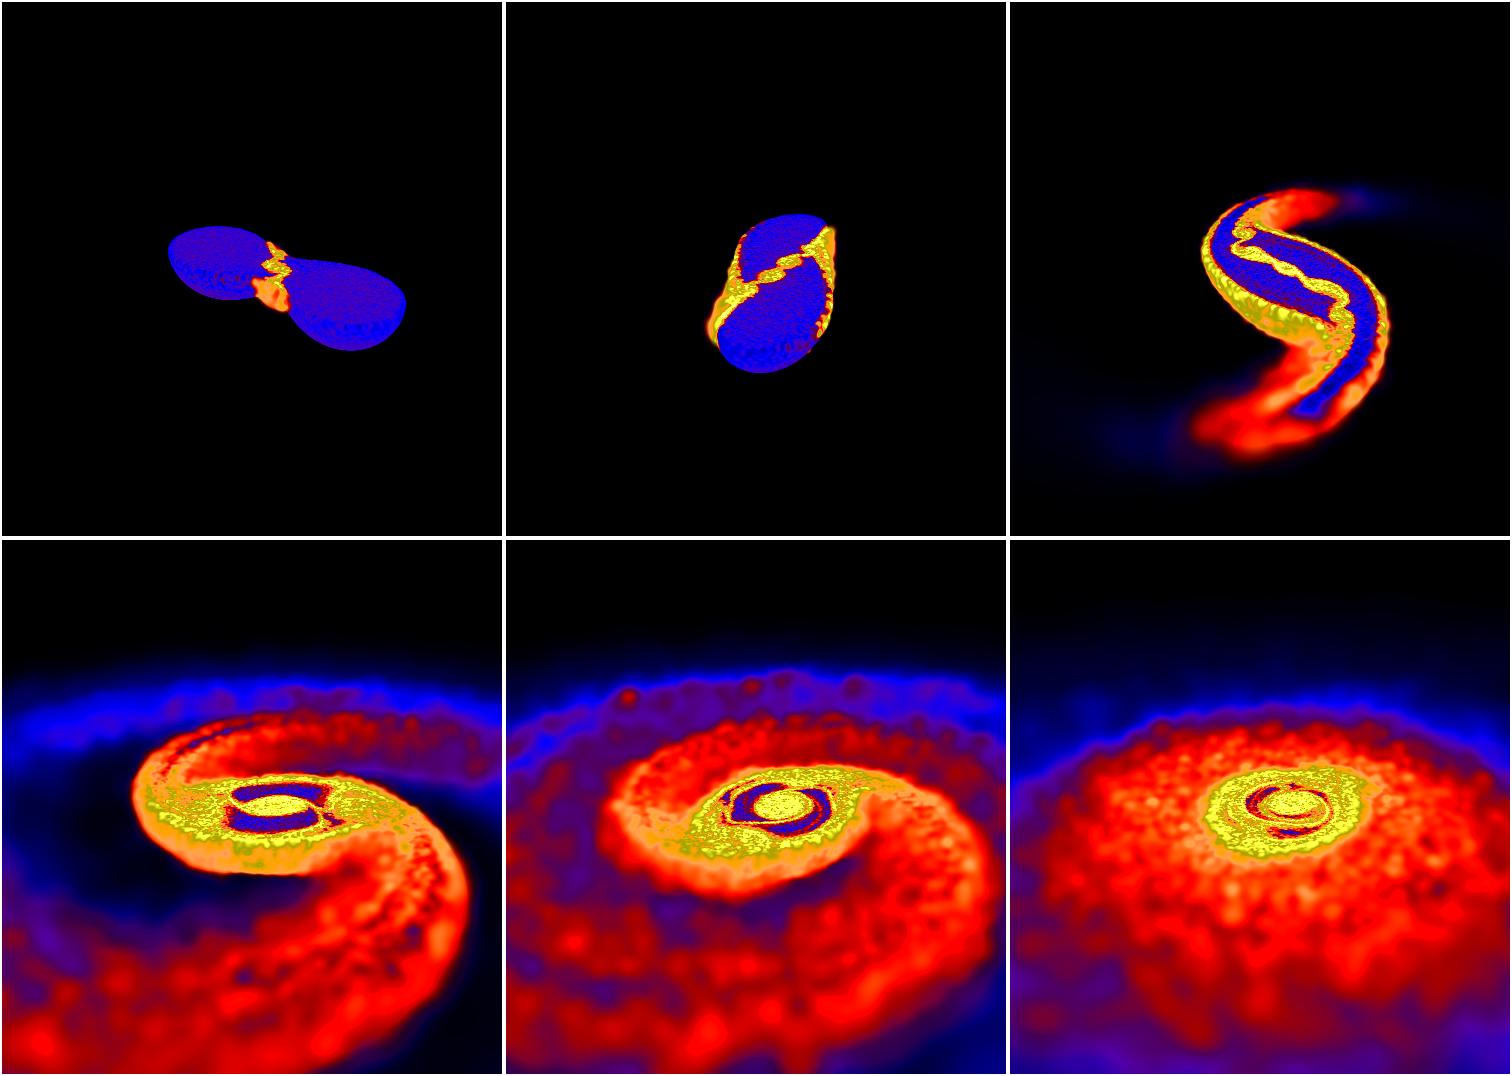
Neutron Star Mergers
Daniel Price (U/Exeter) and Stephan Rosswog (Int. U/Bremen)
Instead, the current favorite sites are NSMs, even more so after the gravitational wave event in 2017.
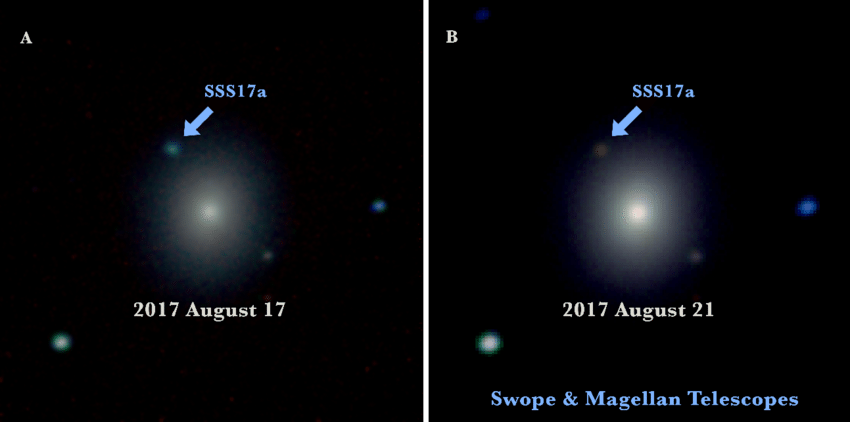
Neutron Star Mergers: GW170817
How can we study the r -process observationally?
Chemically-enhanced r -II stars
In order to study these possible sites observationally, we need a pure signature of the r-process event.
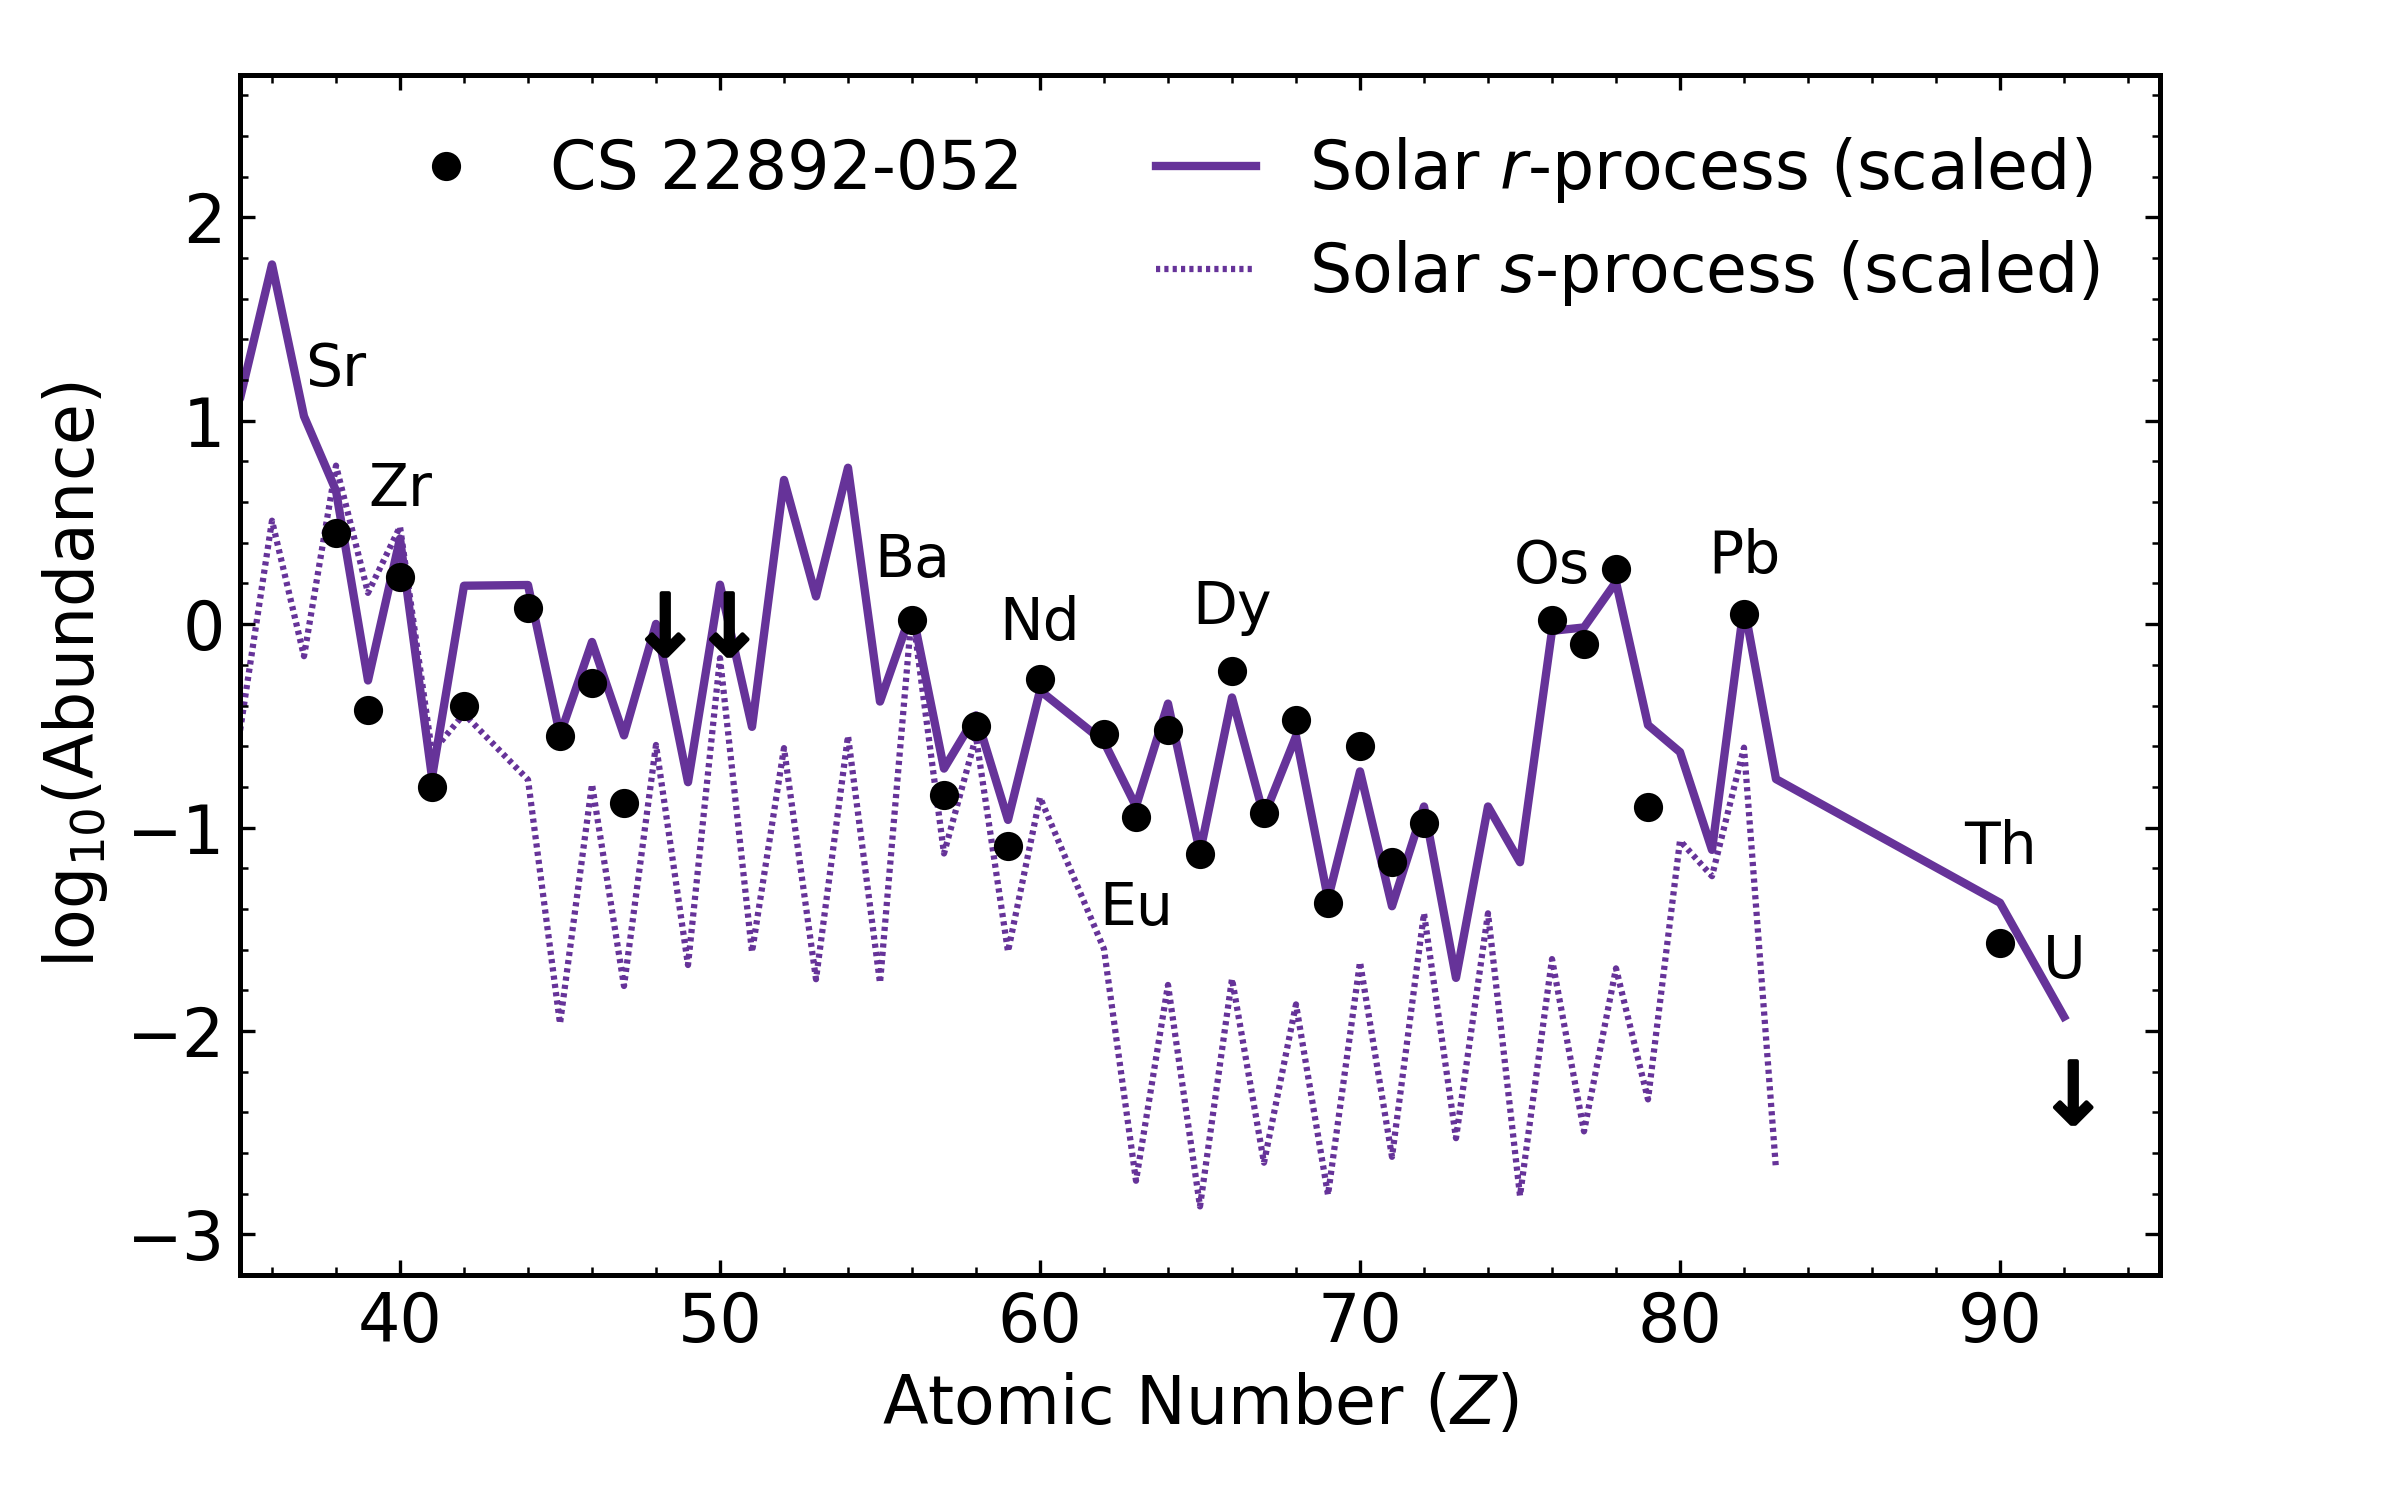
r -II StarsMcWilliam+ (1995), Sneden+ (2003)
R-II stars are perfect for this since they are essentially records of r-process events.
The r-II stars have an elemental pattern that nearly duplicates what we observe in the Solar System.
And on top of that, compared to their iron content, these stars have more than 10 times as much r-process material as the Solar System.
The abundance patterns of r-process enhanced stars like this looks exactly like what we expect an r-process pattern to look like in our Solar System.
**The important difference is that these stars are much older than the Solar System, by about 7 billion years.**
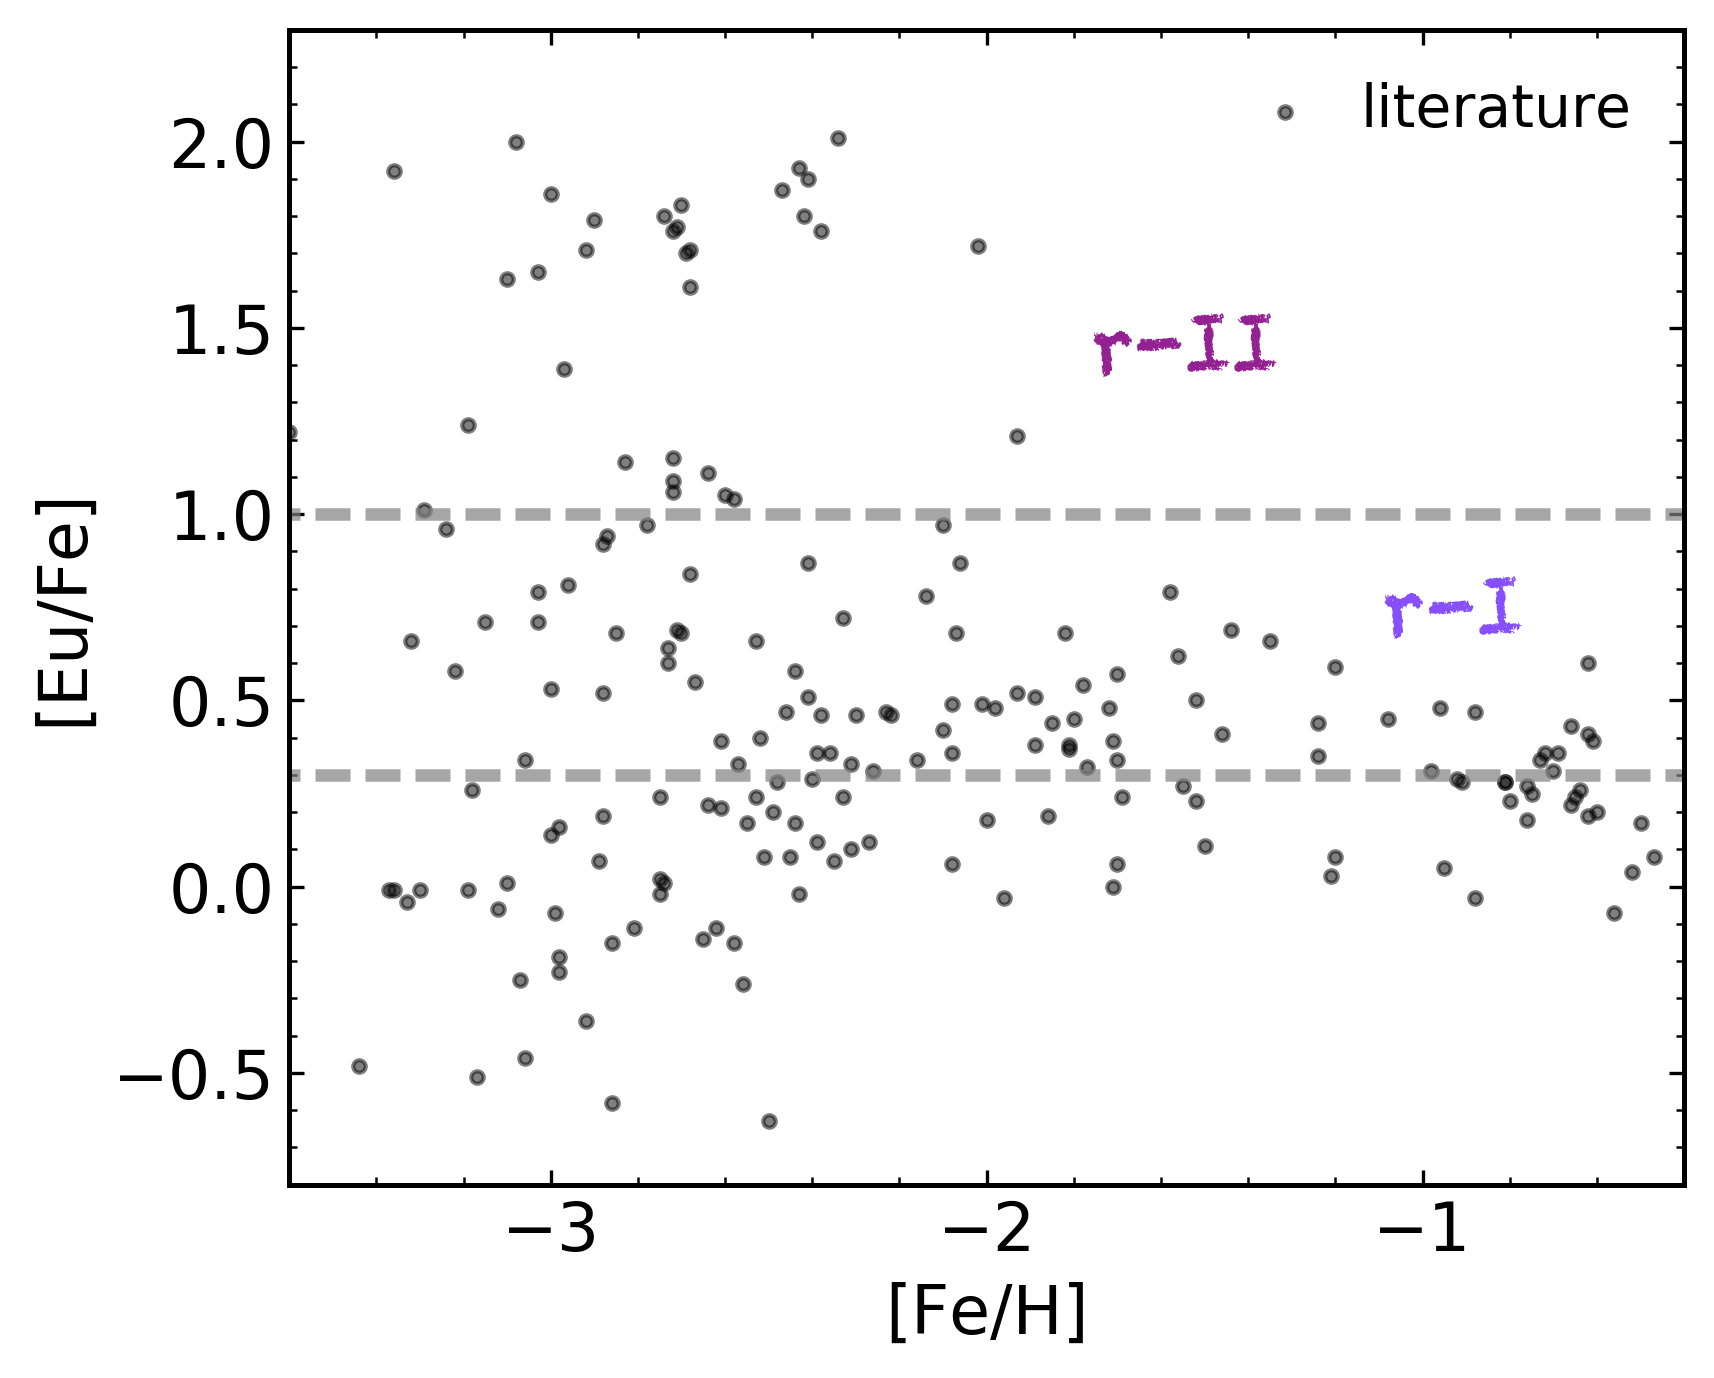
r -Process Enhanced Stars are Rarefrom data in Abohalima & Frebel (2018)
The limitation is that metal-poor stars are already very rare in the MW, and fewer than 5% of those rare stars are r-II stars. If we want to study the r-process observationally and be able to distinguish between r-processs sites, we need more stars that display this r-process signature. So what are we doing about it?
est. 2017 Snapshot high-resolution data obtained for ~1500 (of target 2500) stars
Expect 3-5% to be extremely r -process enhanced (r -II)
Identified over 30 new r -II stars (of ~600 analyzed)
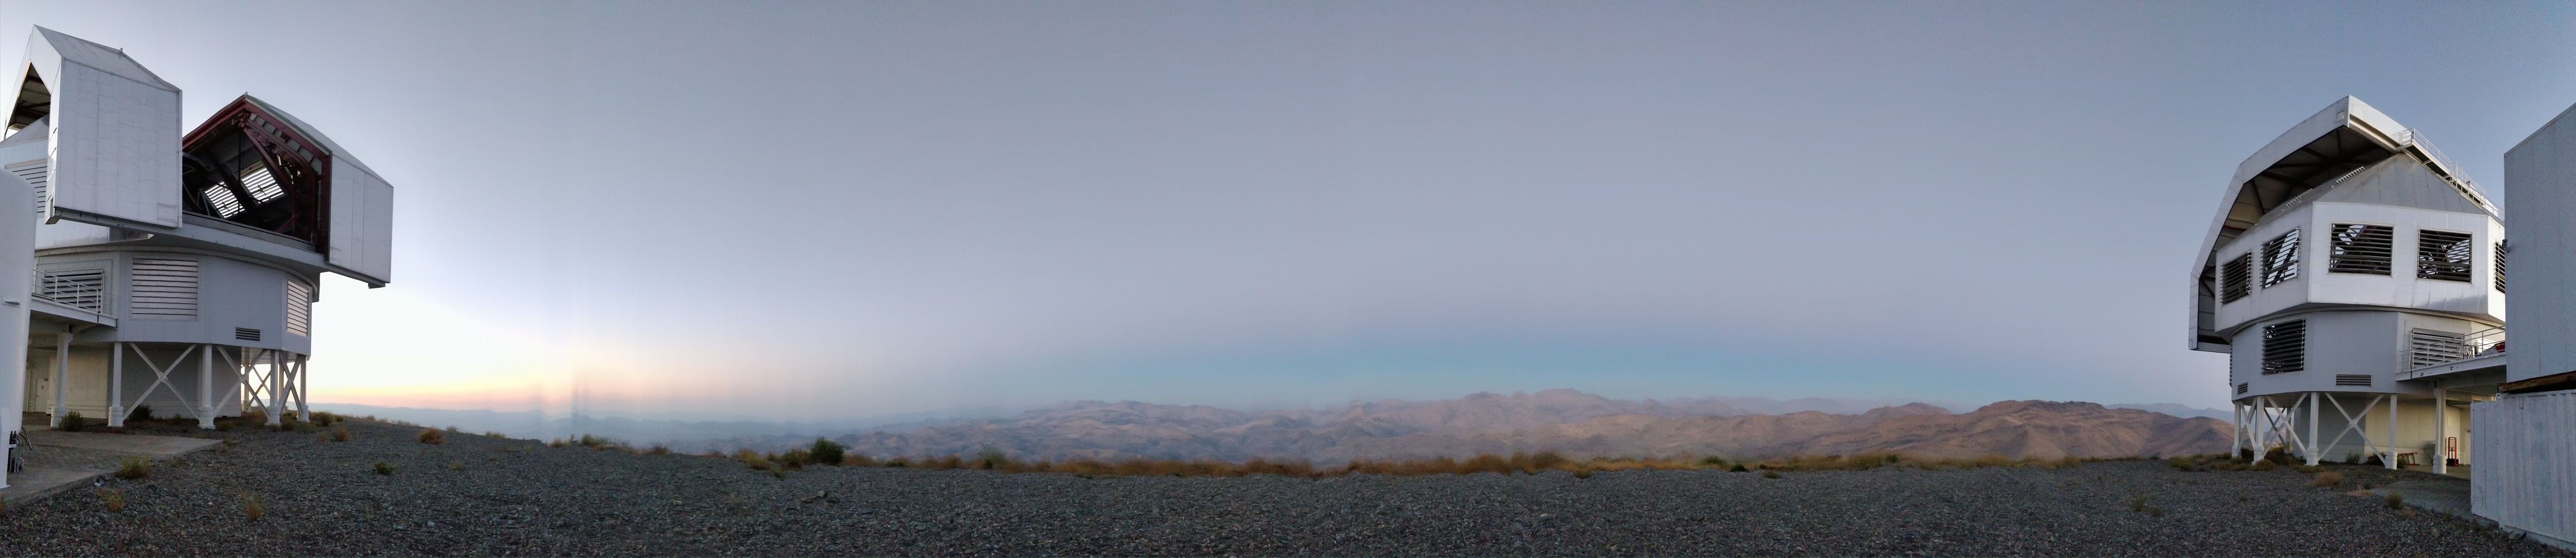
Magellan Telescopes, Las Campanas Observatory, Chile
So a couple of years ago, The R-Process Alliance was established with one main goal to identify more of these r-II stars.
Through this huge undertaking, the R-Process Alliance has already observed over 1500 metal-poor stars.
I have personally observed about 400 of those.
We expect about 3 to 5 percent of metal-poor stars to be r-II stars, so it's necessary to observe such a large number of metal-poor stars to get to our goal of 75.
Of those 500, we have already identified over 30 new r-II stars.
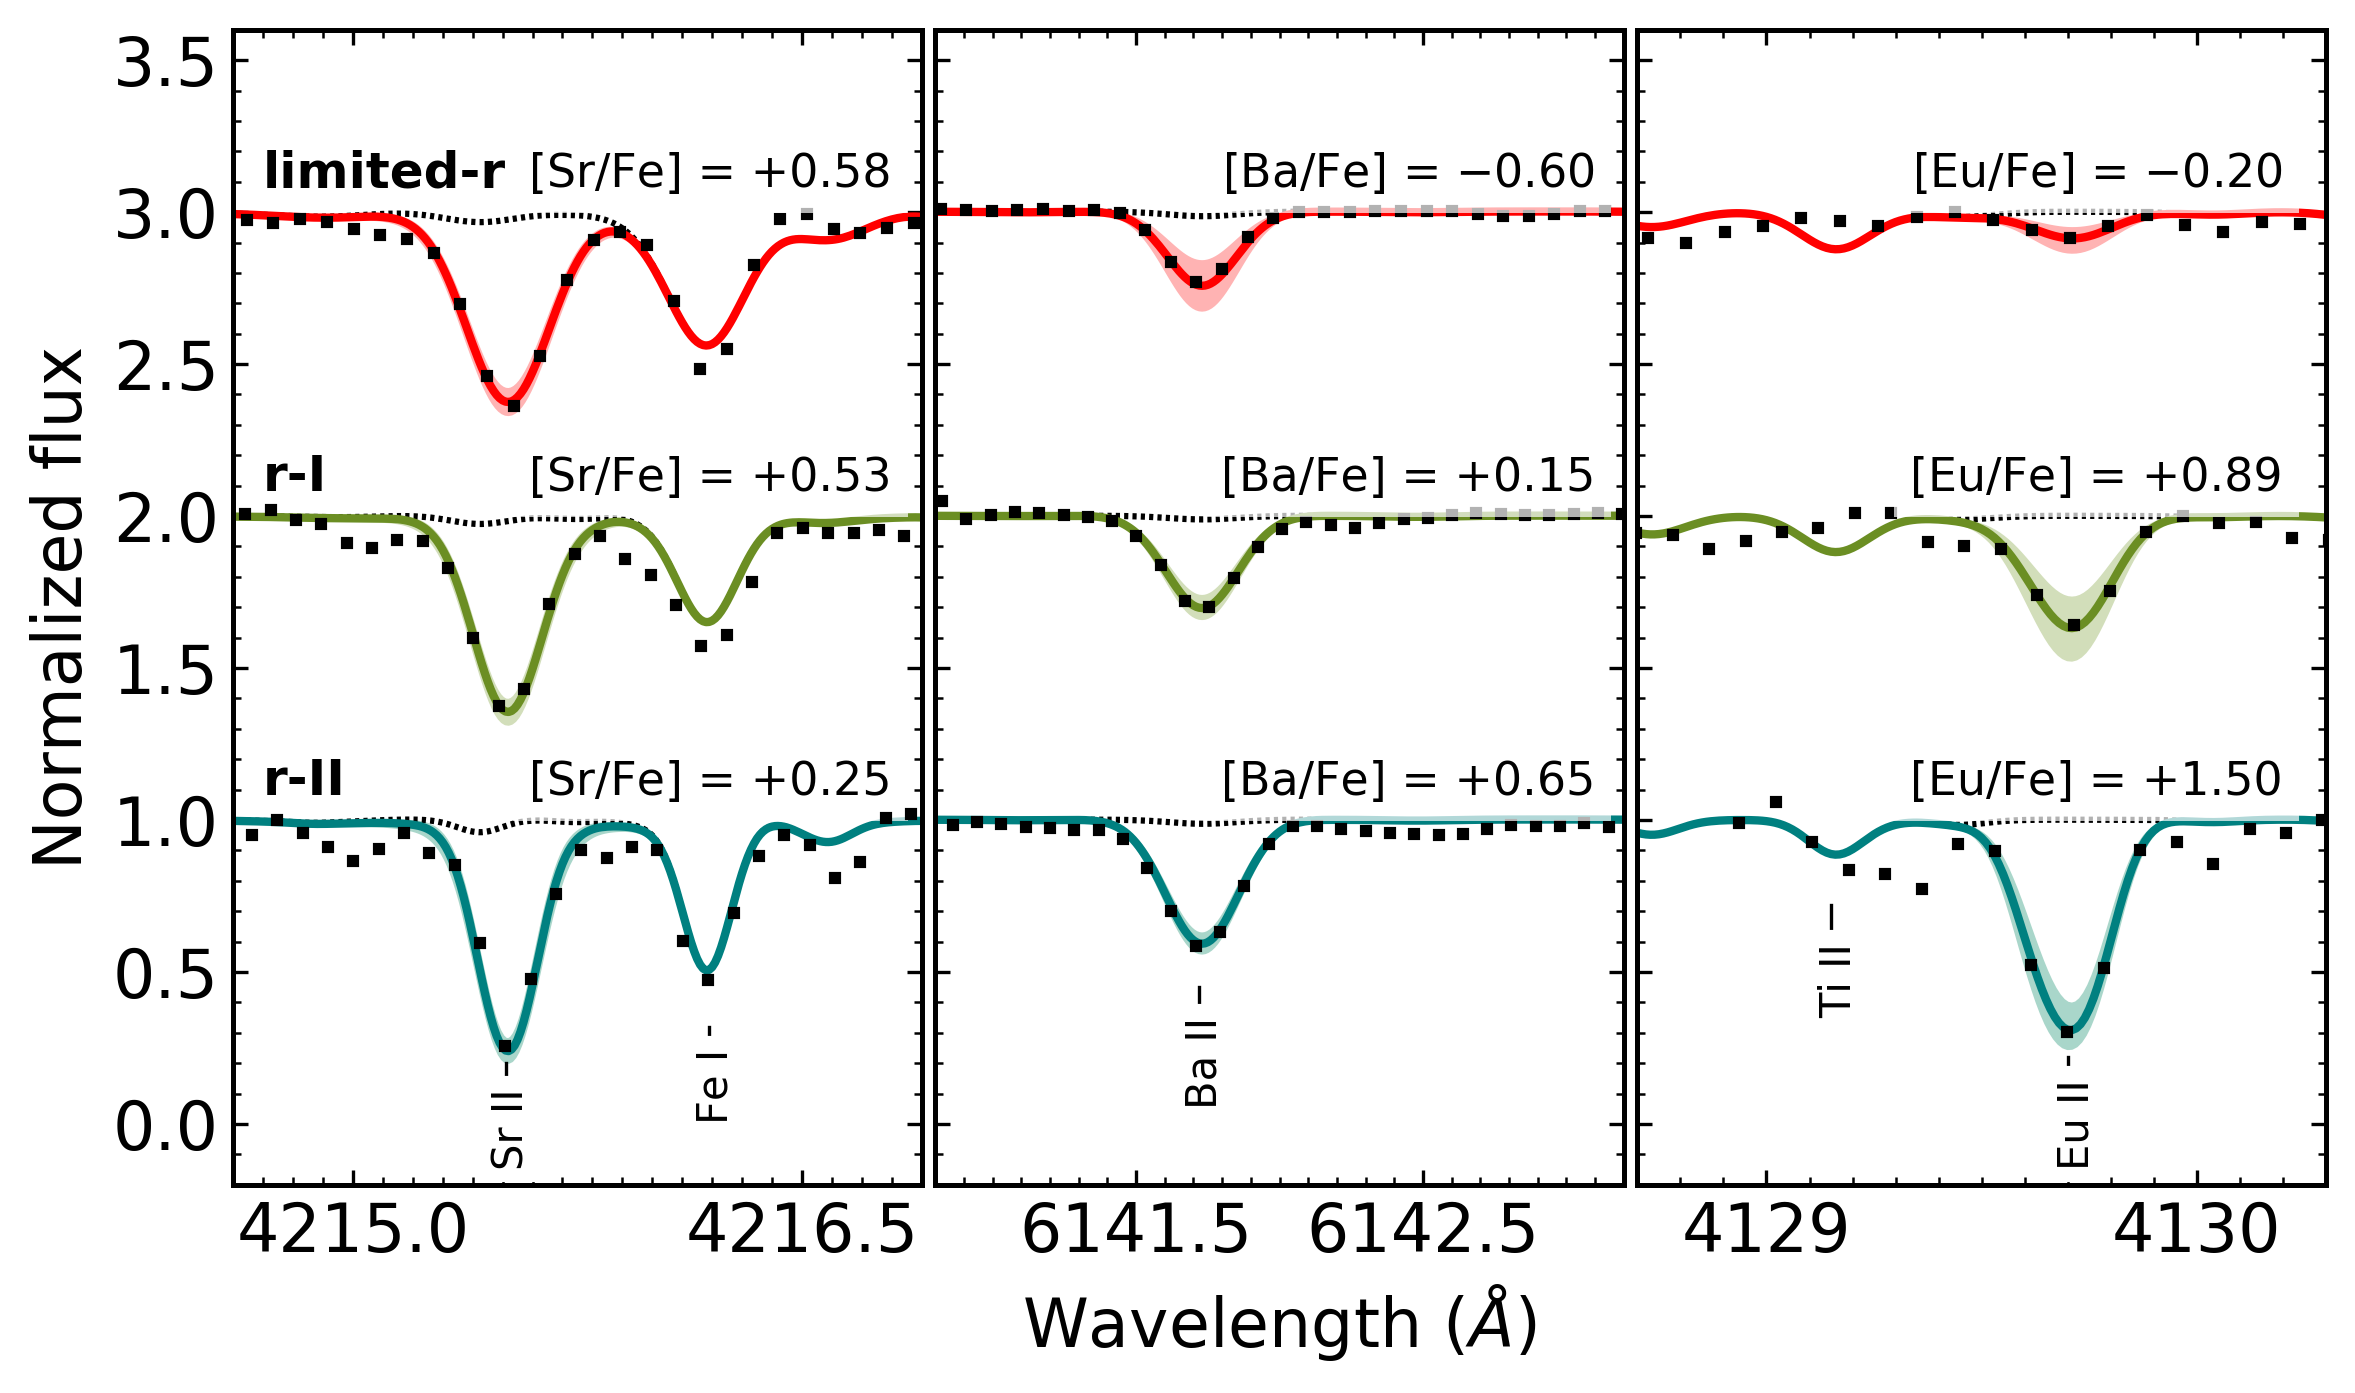
High-Resolution Spectroscopy
Hansen, Holmbeck+ (2018)
How we identify these r-II stars is through high-resolution spectroscopy.
The r-process signatures we look for do not appear with lower-resolution spectra, so we need to take high-resolution.
It takes about 30 minutes on a 2.5-meter telescope to obtain each of these spectra.
We look for mainly three elements to characterize the stars we observe: Strontium, Barium, and Europium.
Then we use the relative abundances of these elements to classify whether the stars are r-process enhanced.
In particular, we use Europium to classify r-II stars since Europium is mainly produced by the r-process.
Notice this r-II star has a very strong Europium feature, but these other two stars are not as enhanced in r-process elements.
We do this for each star in our sample in order to produce plots like these [NEXT SLIDE].
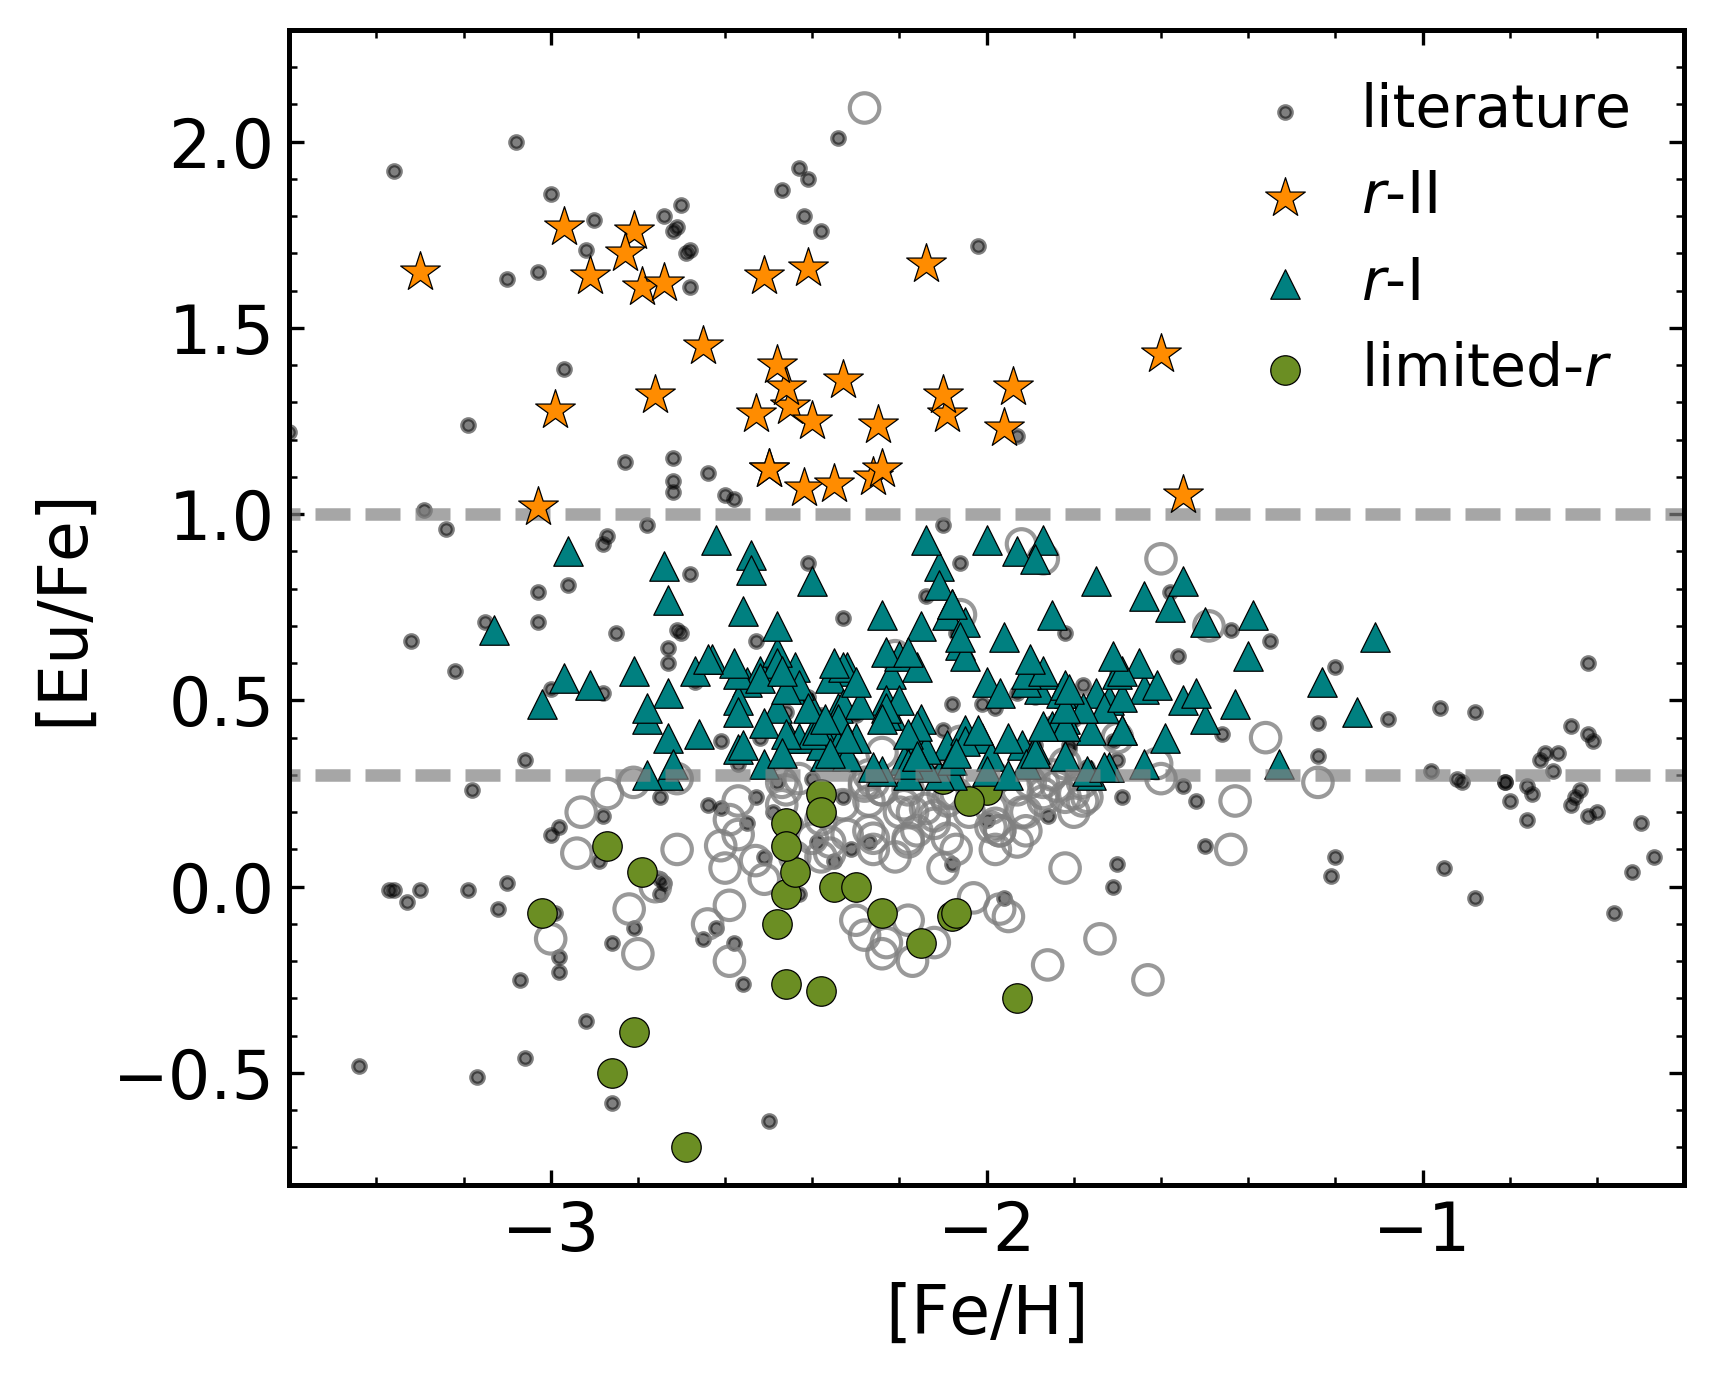
Doubled Number of Known r -II Stars
from RPA data (2017-2019)
This is what the RPA has been able to accomplish over the last couple years, so far.
We've identified many more r-II stars and a lot of r-I stars, which are moderately-enhanced with r-process material.
Our goal is to get 100 in this upper part.
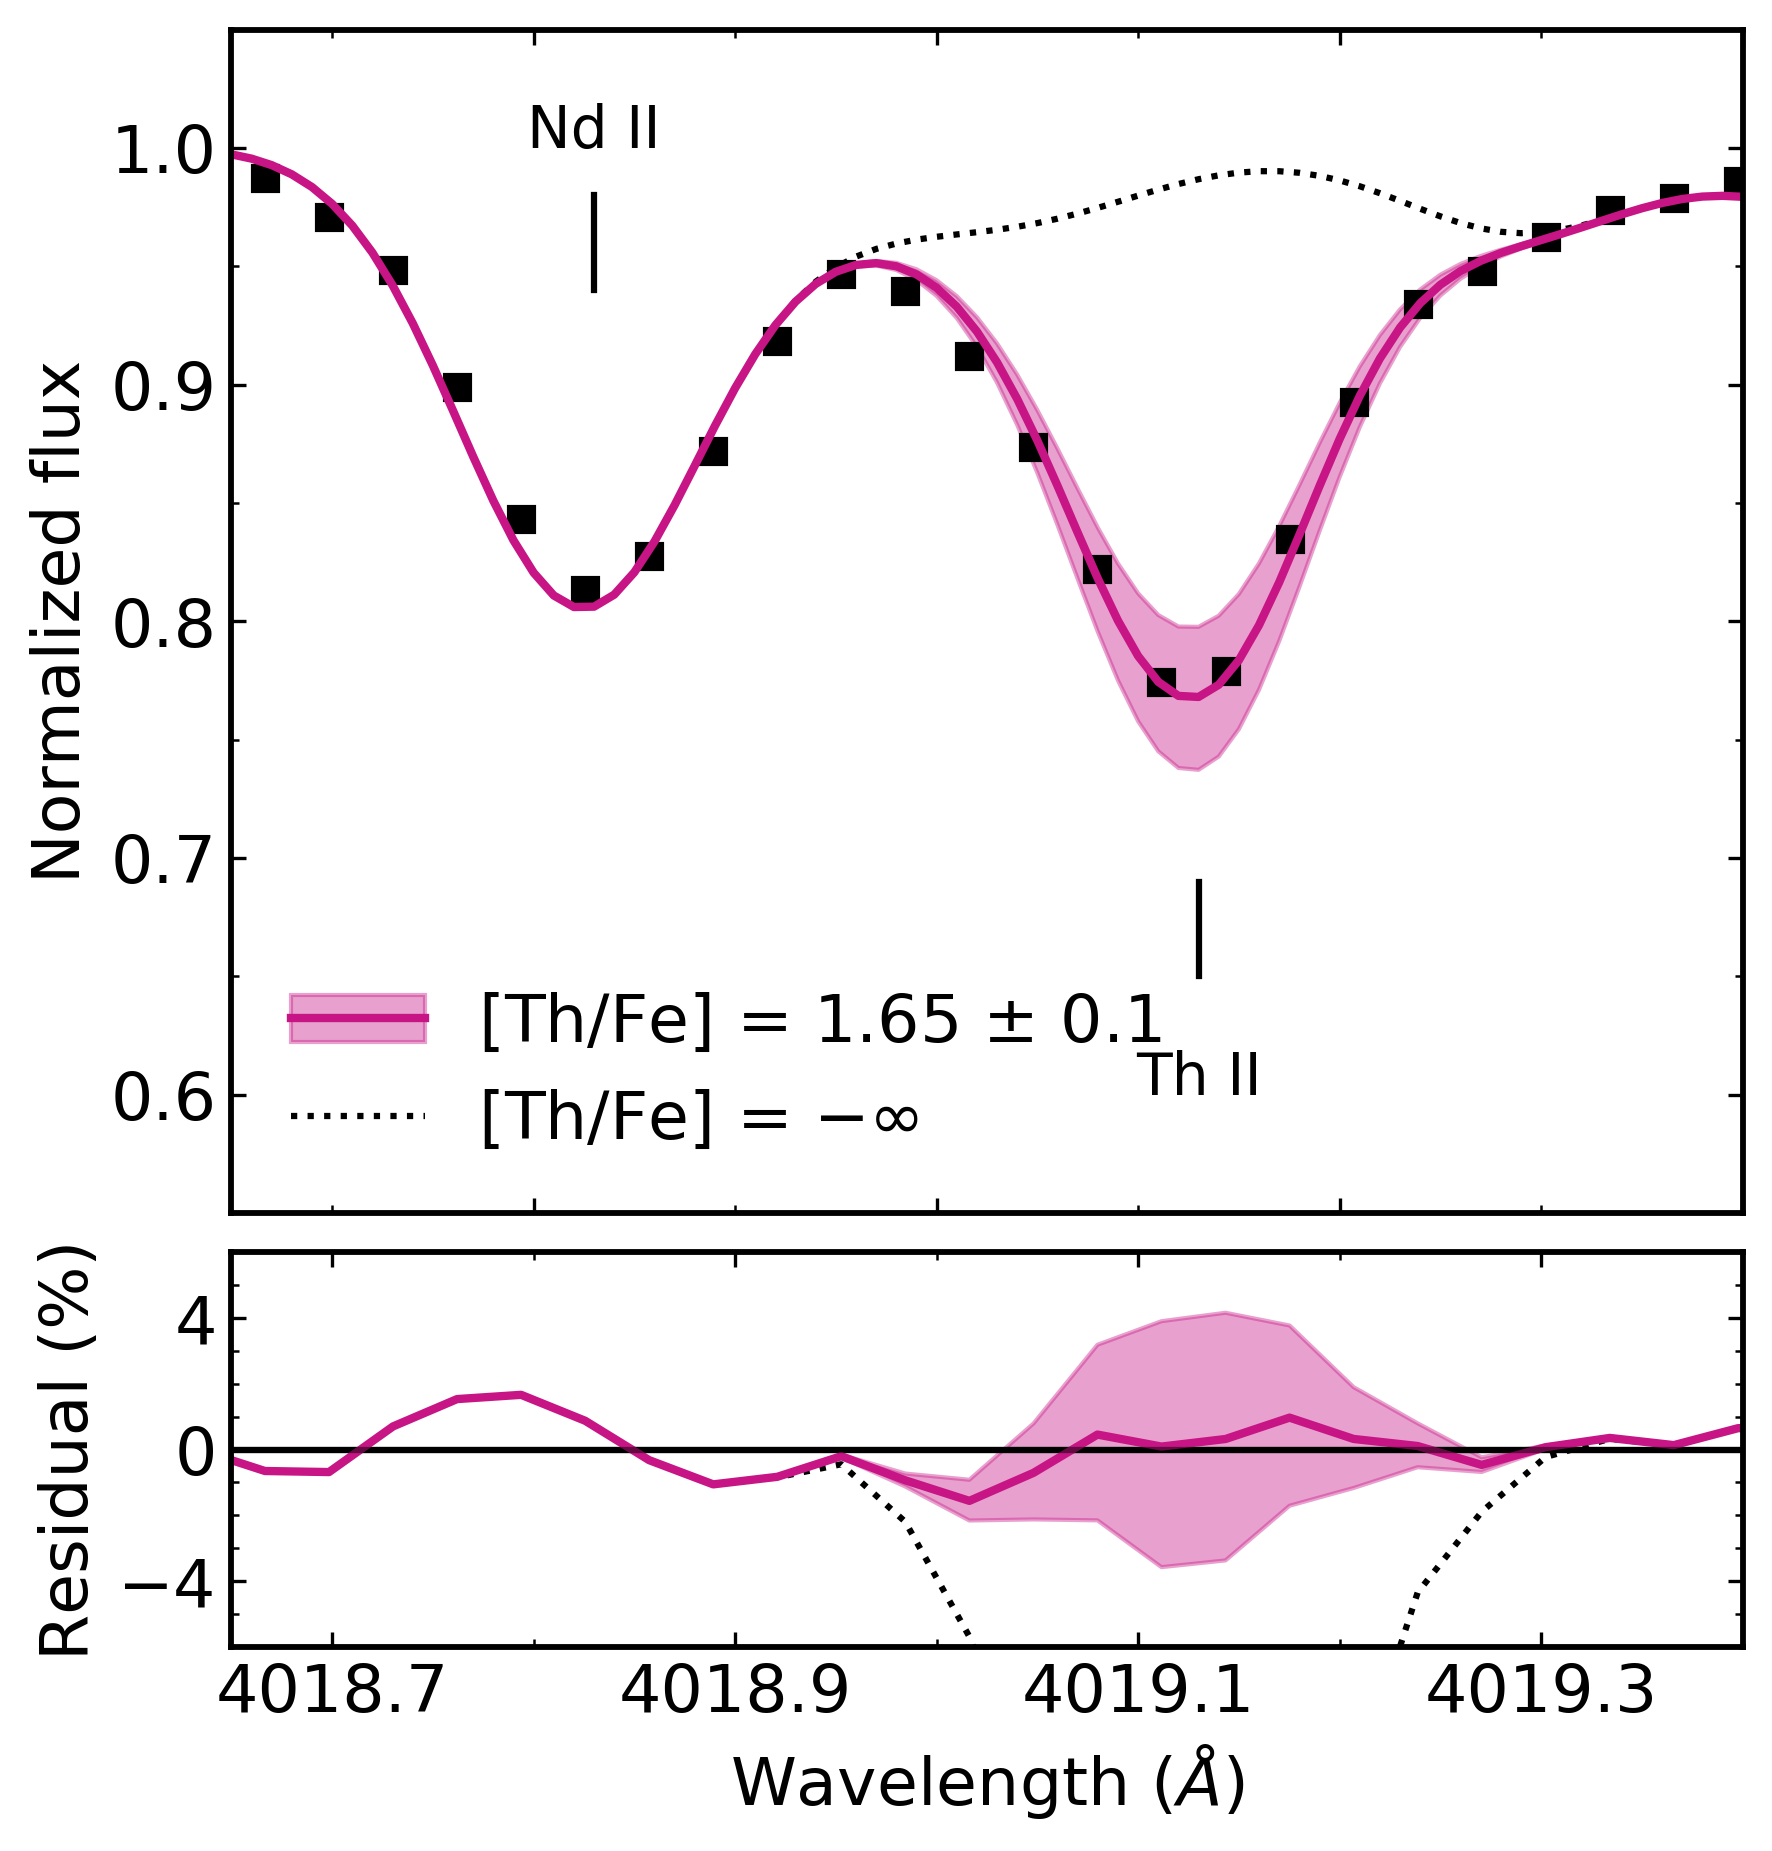
Actinides in r -II Stars
Placco, Holmbeck+ (2017), Holmbeck+ (2018)
In some stars, we observe the entire range of r-process elements.
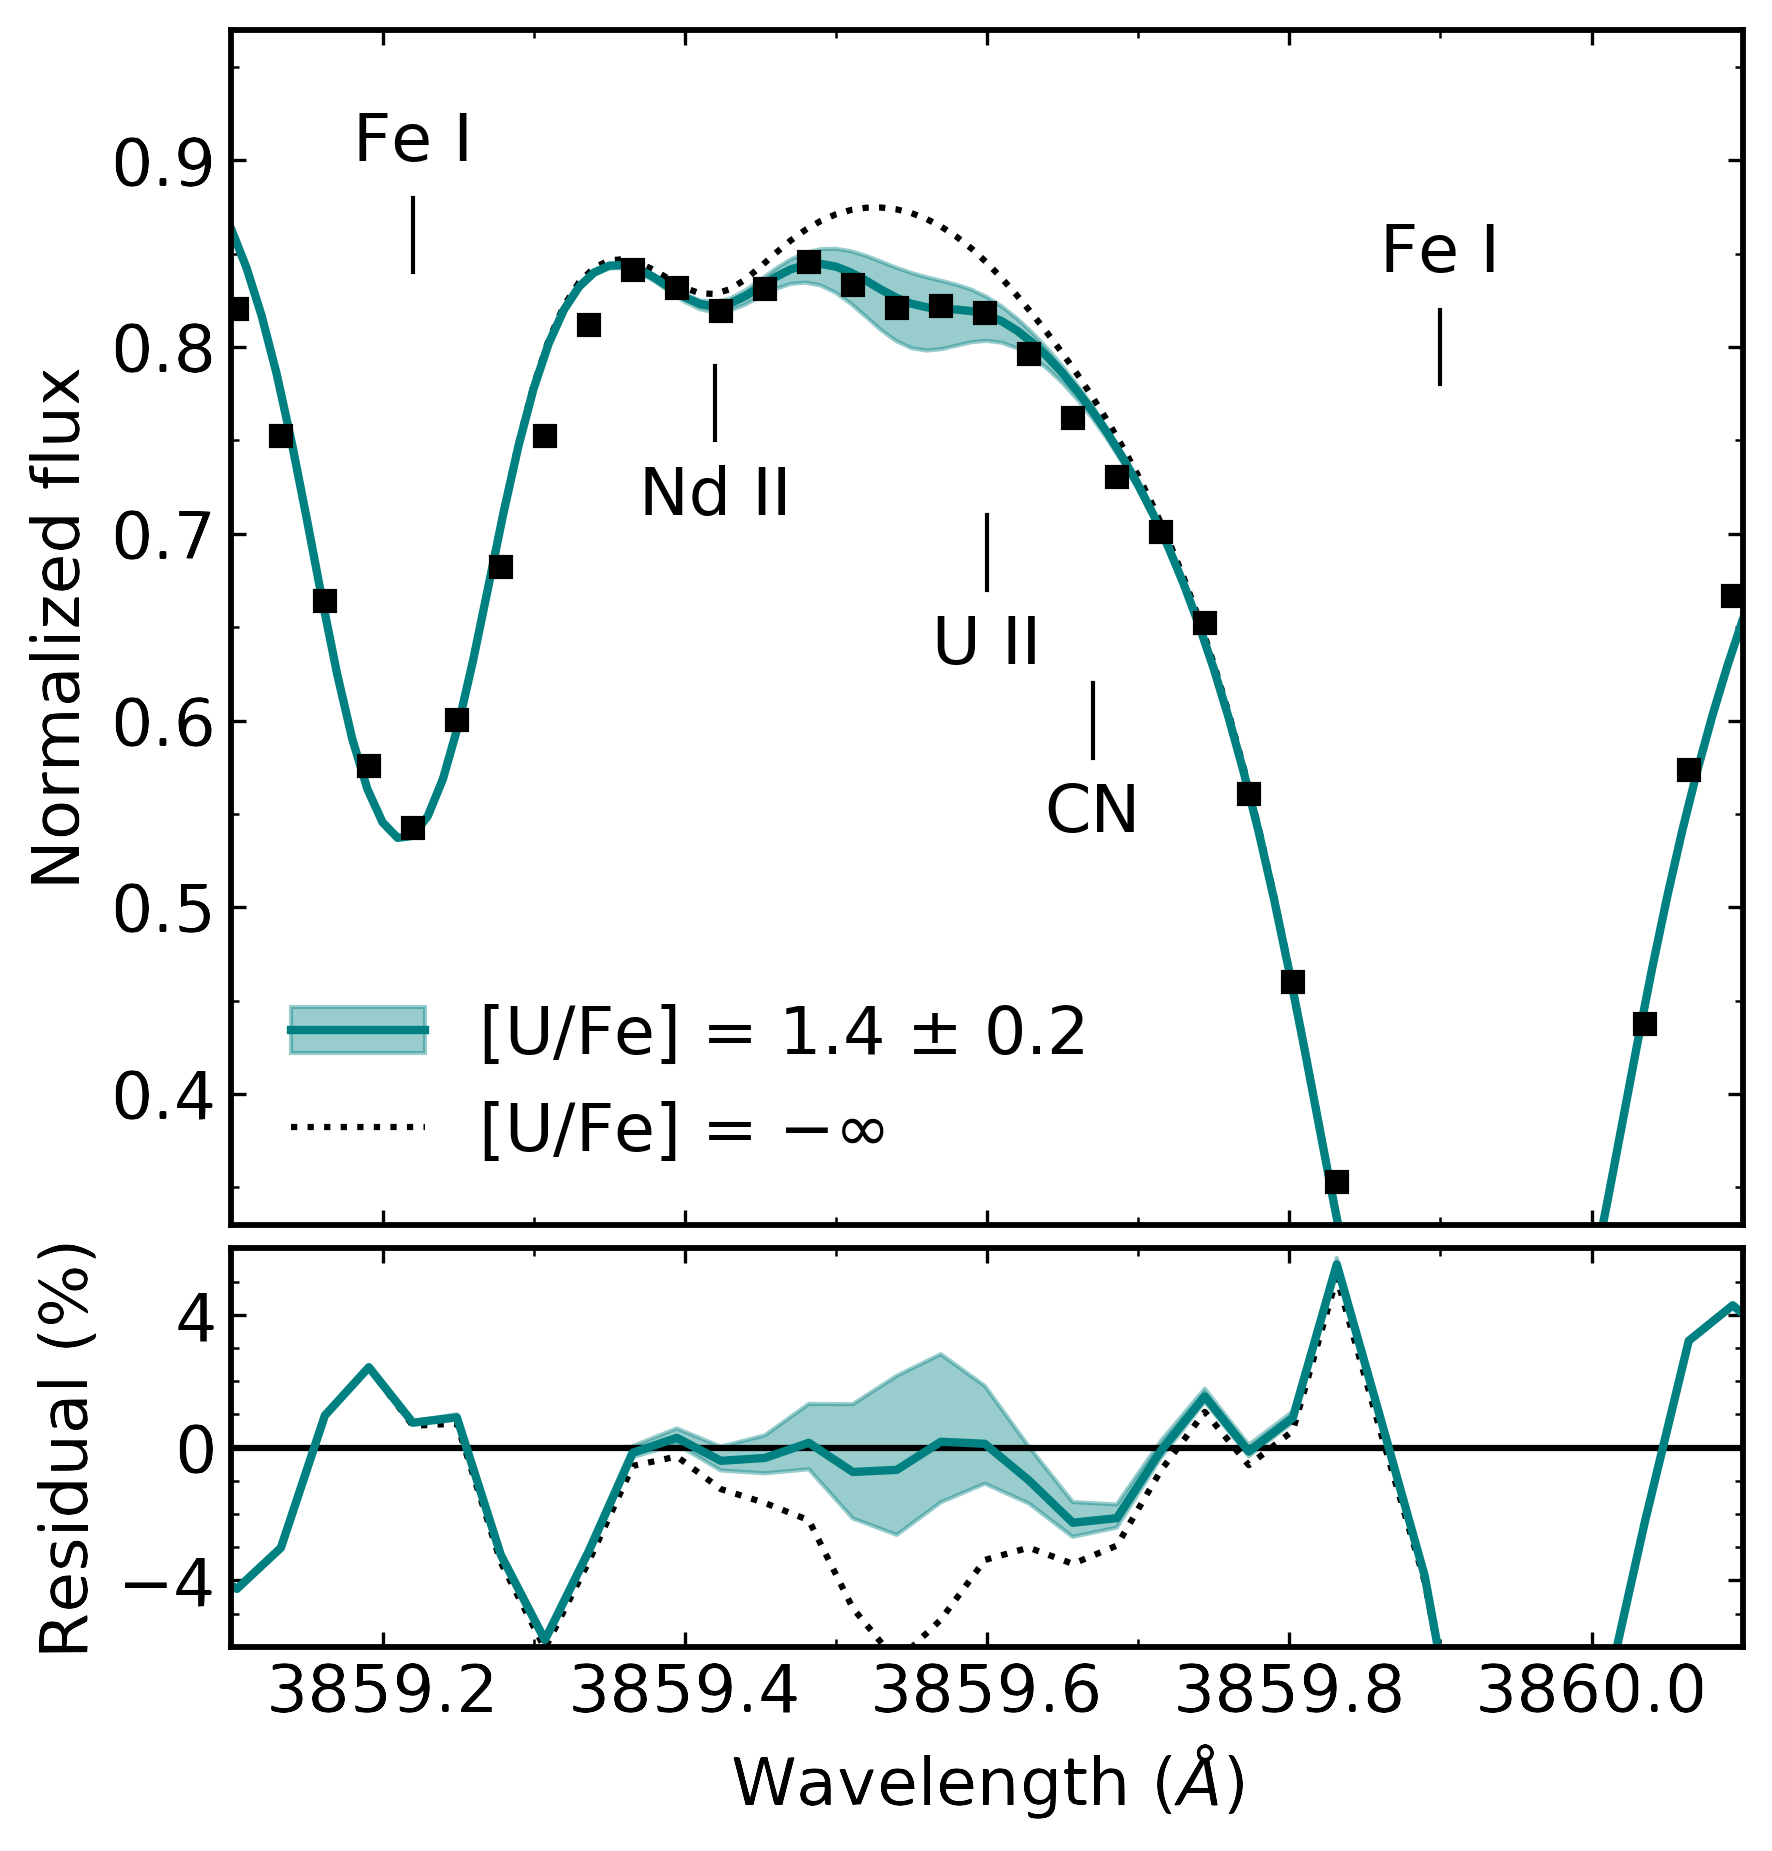
And sometimes, we can measure the actinides, Th and U.
Here is an example of a Th measurement and a U measurement in two different r-II stars.
The Actinide Boost
Holmbeck+ (2018)
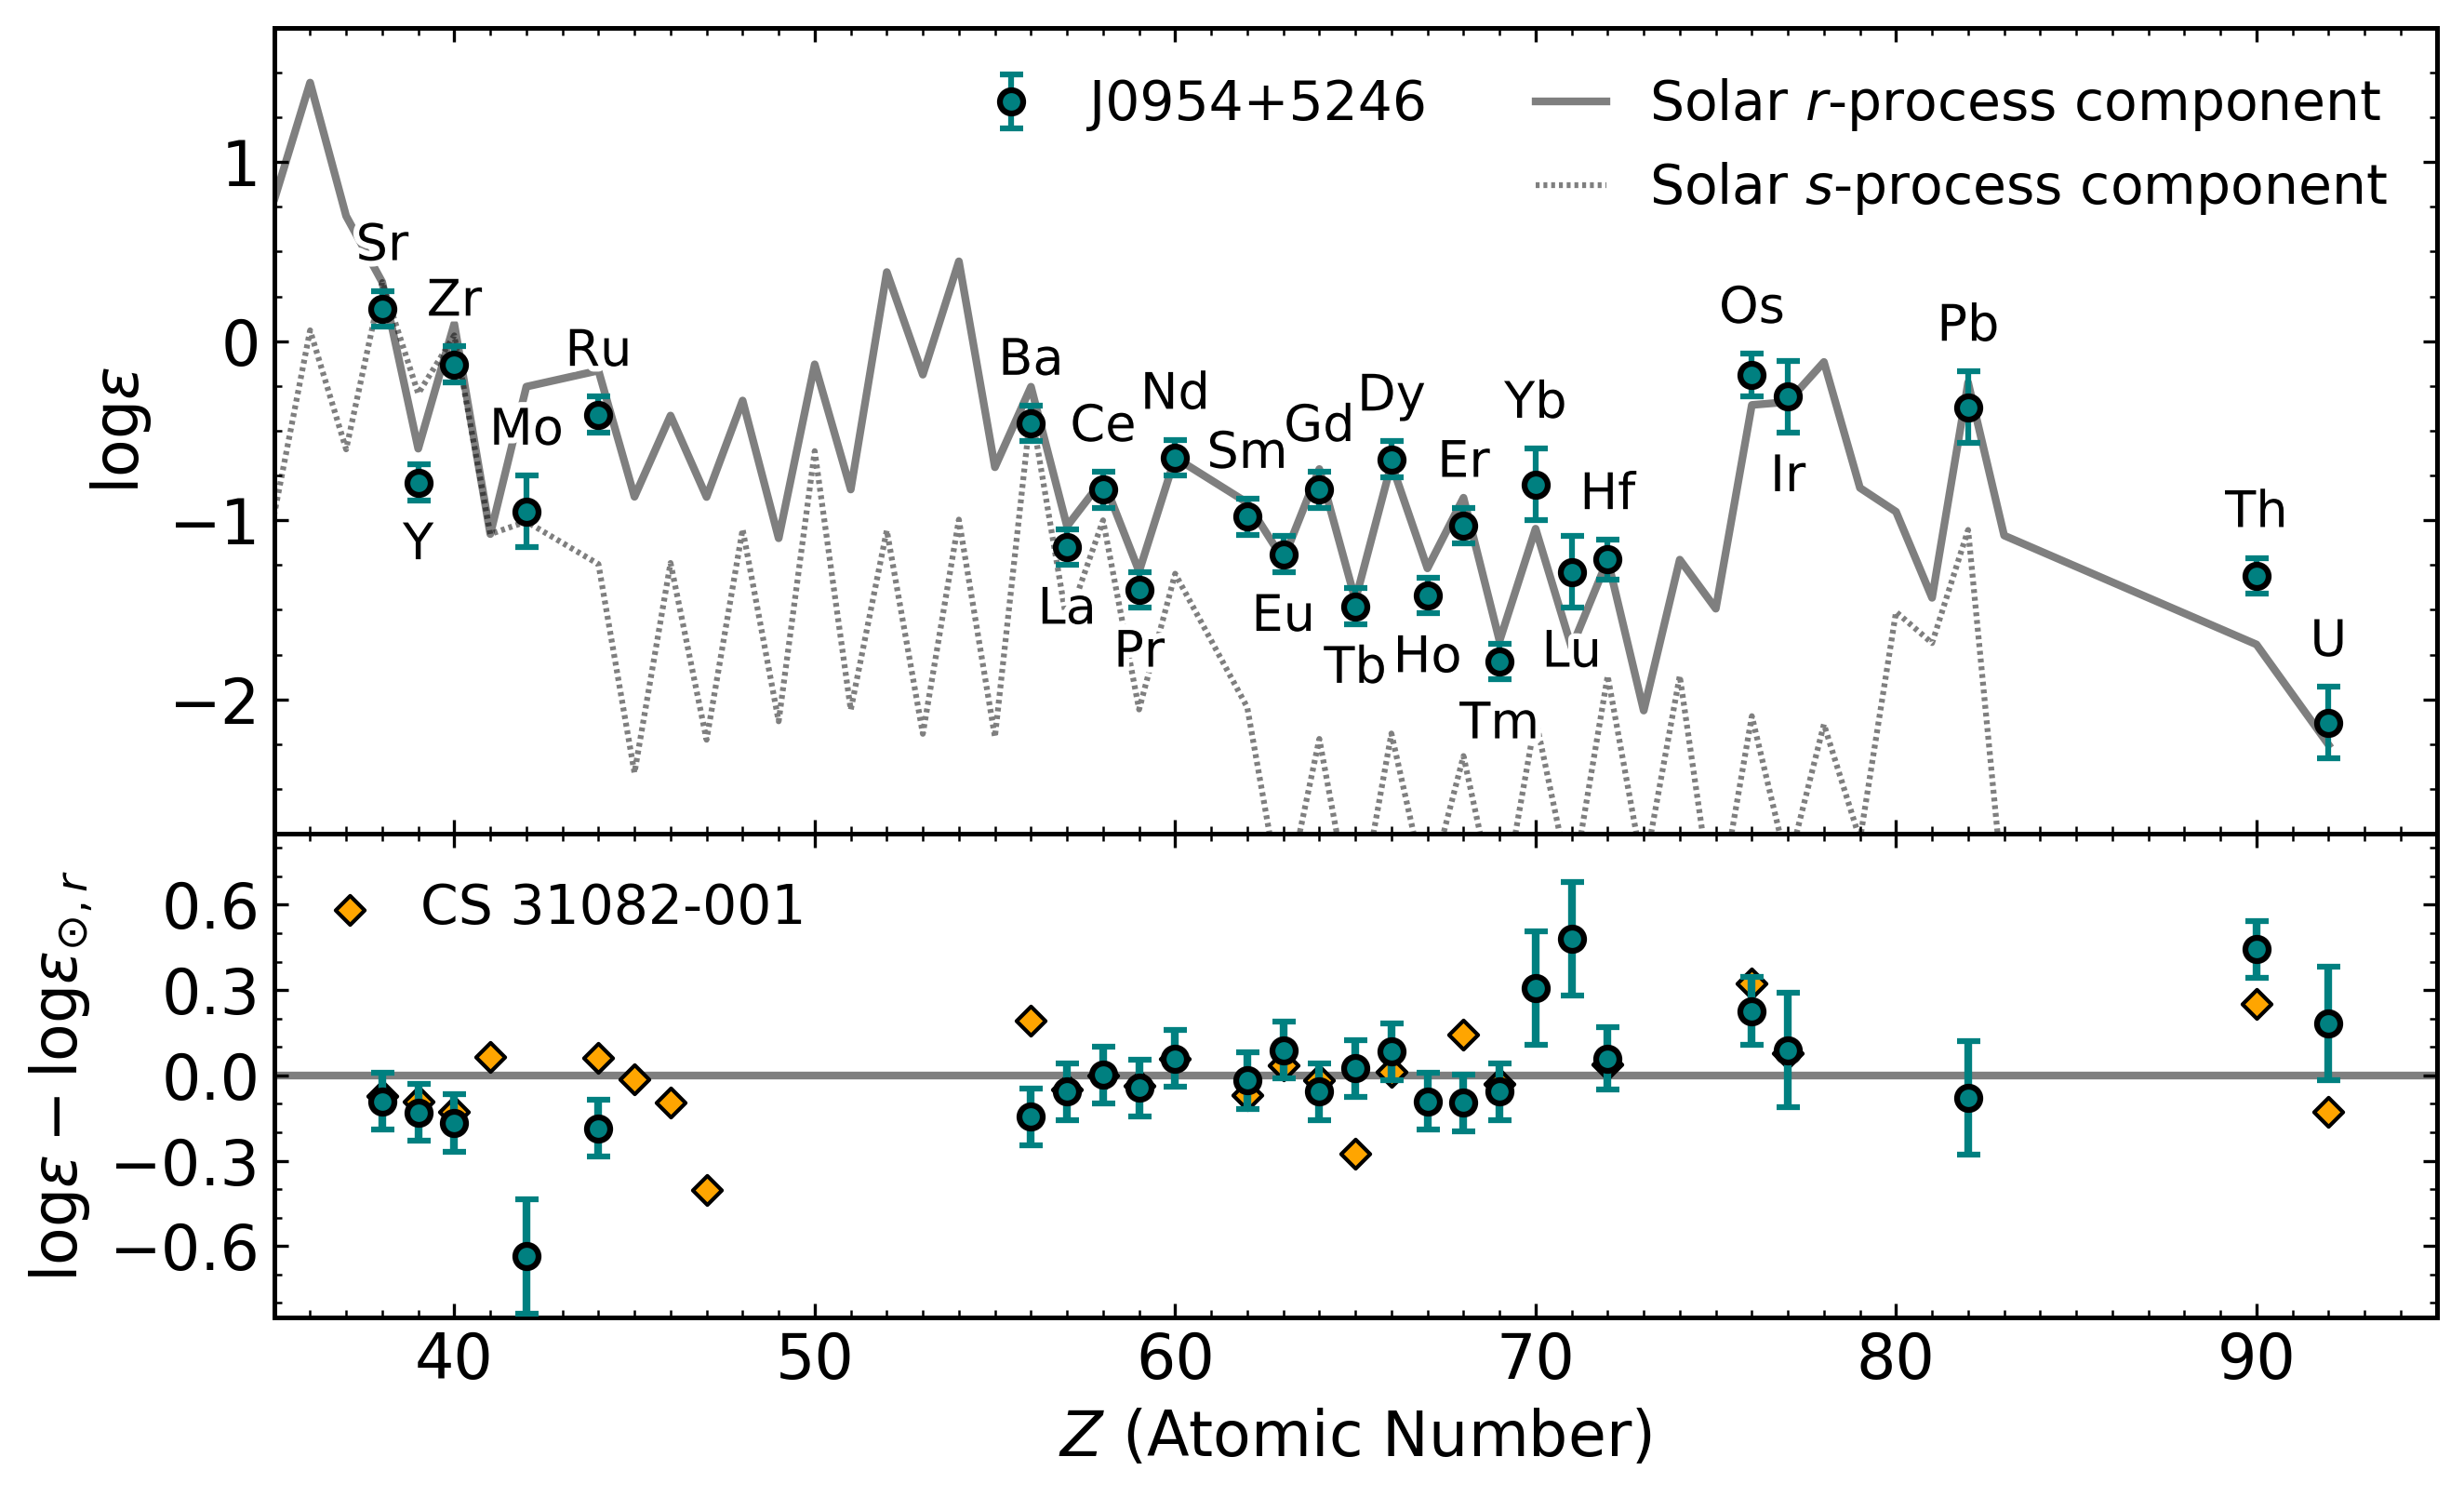
Now, what is the actinide-boost? It is an r-process-enhanced star that shows an extra enhancement of the actinides. The rest of the r-process pattern looks like every other r-II star, and the actinide abundances are much greater than what's in the Solar System. Compared to this canonical actinide-boost star, CS 31082-001, it is even more enhanced than that star.
What is the source of this actinide-boost?
Actinide Variation
Th/Eu r -process enhanced stars
Actinide variations could be a hint to key r -process characteristics
Holmbeck+ (2019b)
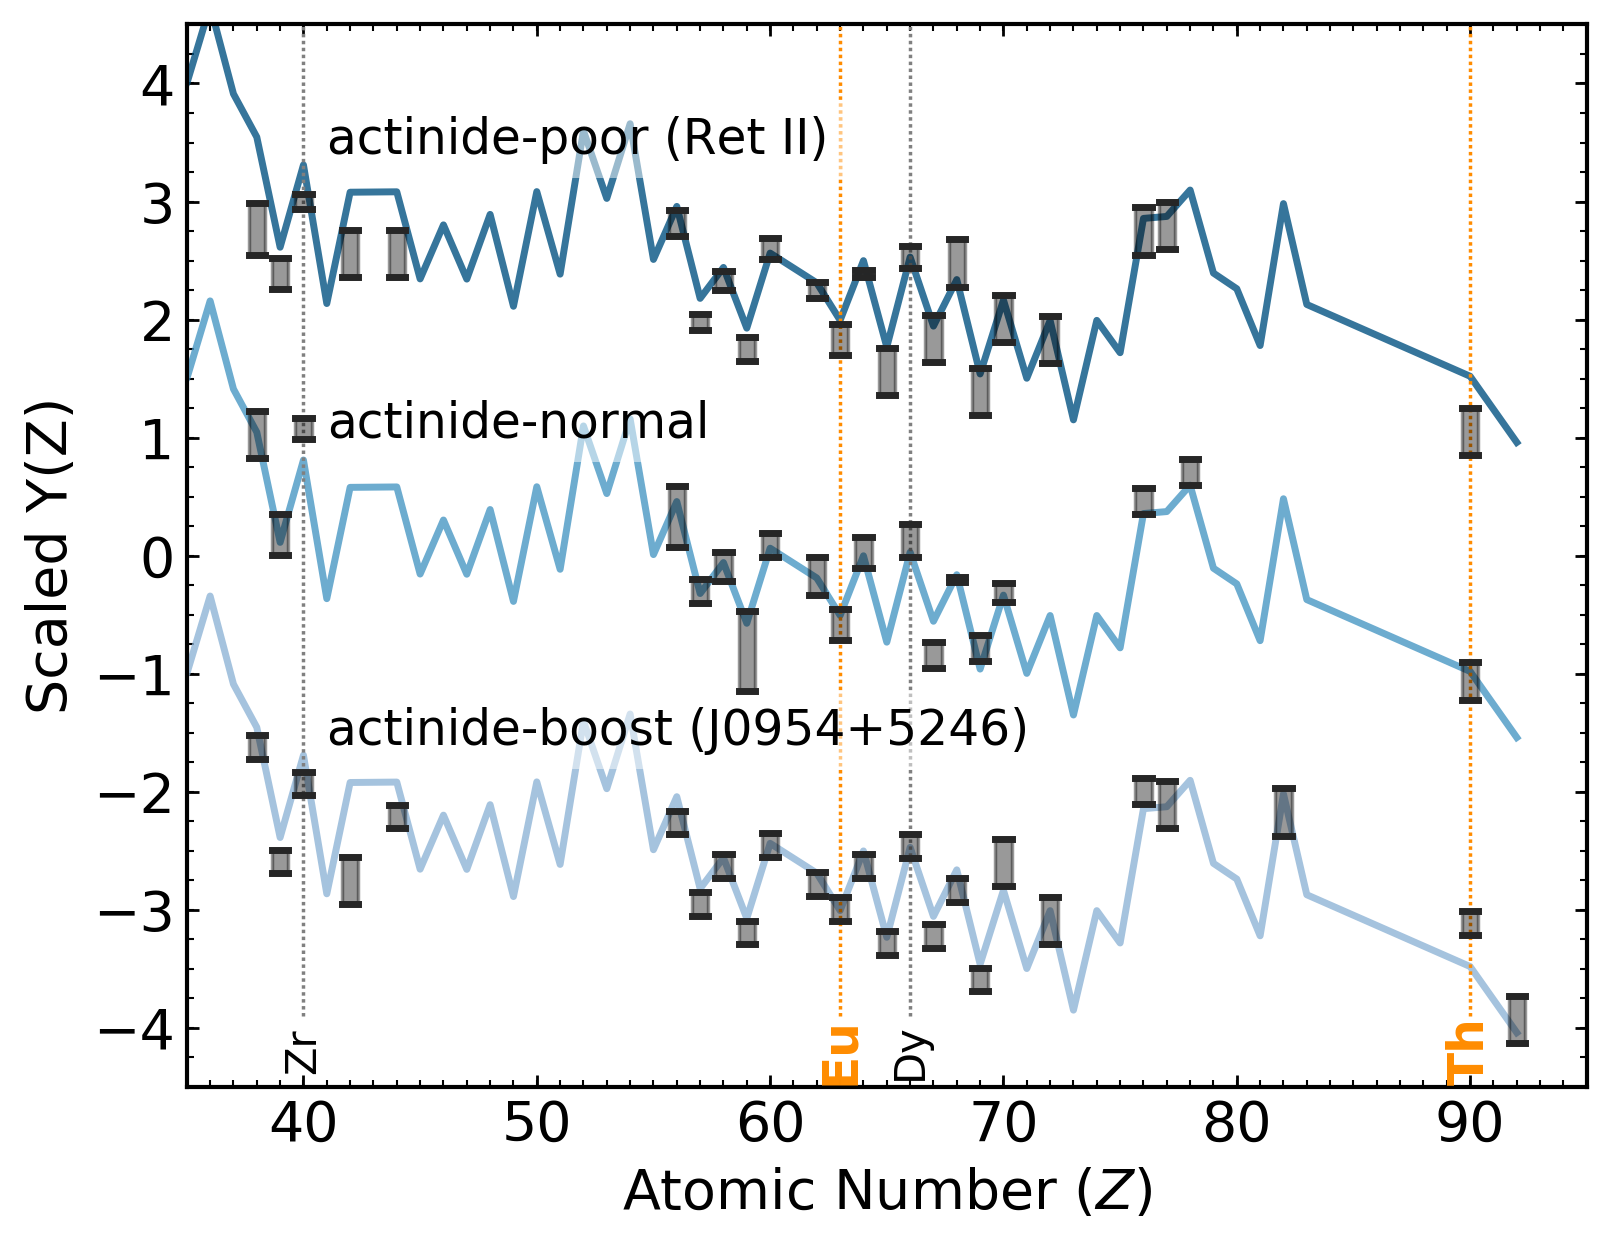
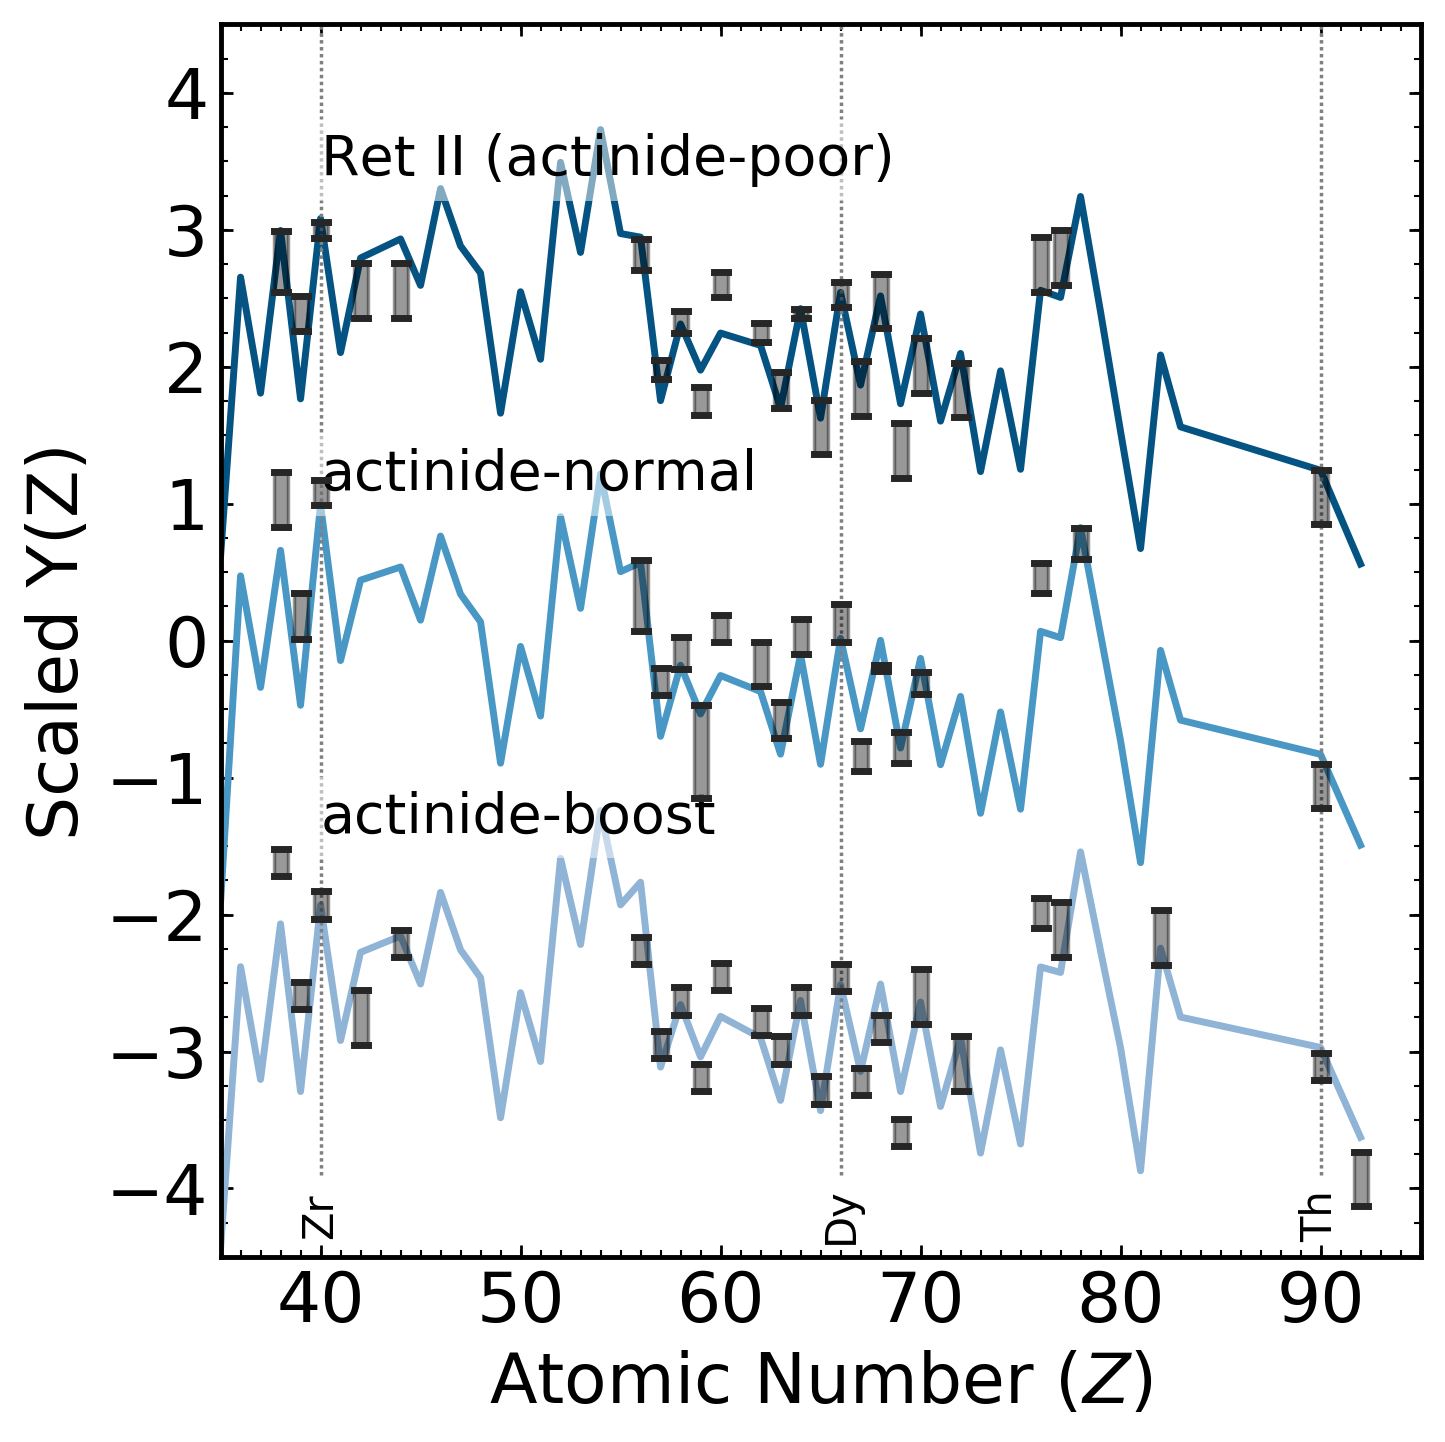
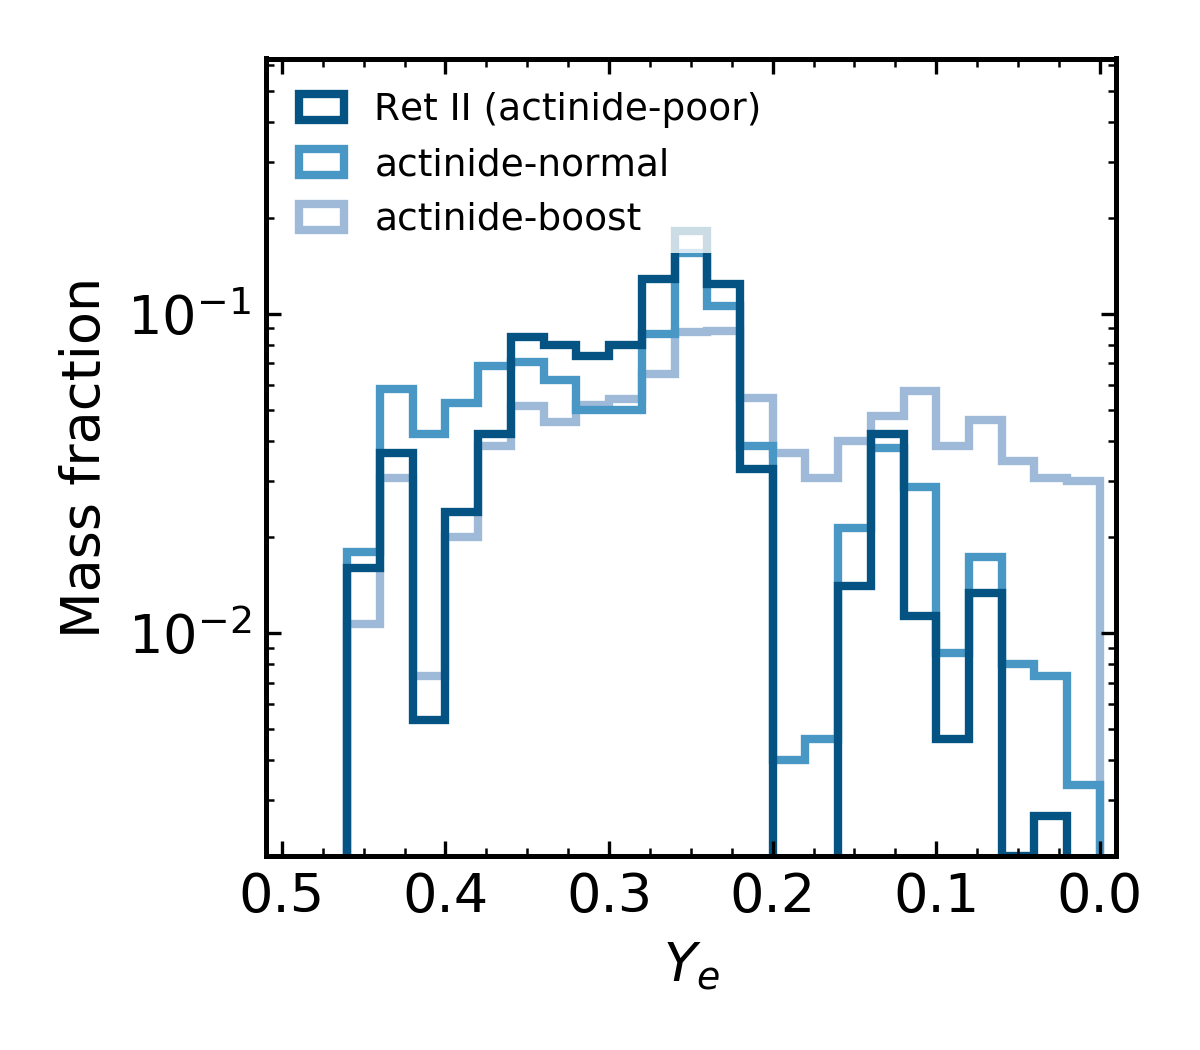
For stars that show the entire r-process pattern, there is a variation from star to star in the actinide-to-lanthanide ratio.
For example, in Reticiulum II, the "r-process dwarf galaxy," the one star where a thorium abundance could be measured shows a low actinide-to-lanthanide abundance.
Most r-proces enhanced stars have a relative thorium abundance that approximately agrees with the Solar value, and some are enhanced in thorium, these actinide-boost stars.
These differences in the relative actinide abundances could be a hint that certain r-process conditions, or point to different r-proces sites entirely, are responsible for producing the actinides.
Actinide Production and Ye
Th and U are produced by the r -process
The electron fraction, Ye, r -process event
e = [1+(n/p)]-1
In an astrophysical r-process event, the initial electron fraction---or Ye---is one parameter that sensitively affects the final r-process abundances that are produced.
Just as a reminder, a lower Ye means more neutron-rich, and higher Ye is more proton-rich
and essentially sets the initial amount of neutrons that are available to participate in neutron-capture.
[MOVIE] For example, with all else being equal, in certain situations, starting at a somewhat low Ye may produce just the second r-process peak---elements like Barium and Tellurium.
Decreasing the initial Ye produces the lanthanides, but not necessarily the third peak.
Further decreasing the initial Ye can eventually produce actinides in the final abundance pattern.
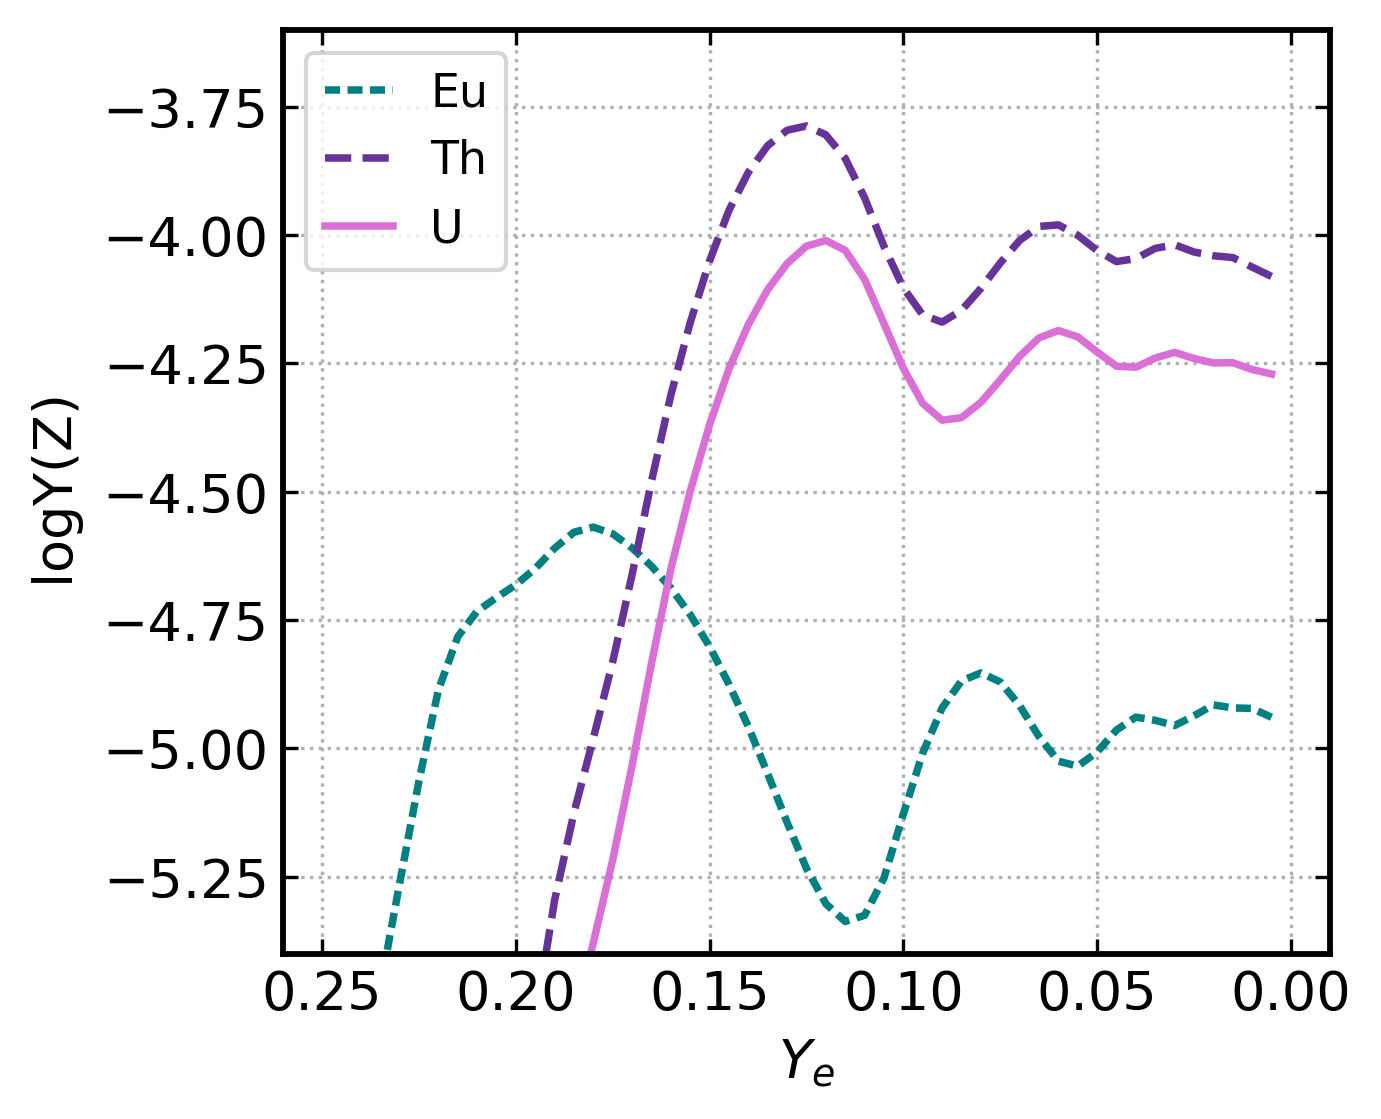
Then, as the initial material gets more and more neutron-rich, the actinides oscillate. We see this explicitly in [NEXT]
Actinide Production and Ye
overproduced e
Holmbeck+ (2019a)
...this plot, which shows the final actinide and Eu abundance as a function of decreasing Ye.
We thought this variation could explain the actinide-boost.
It turns out that **if you assume all the r-process ejecta has very low Ye**, the actinide production is too great to explain even actinide-boost stars,
and this production doesn't agree with stellar abundances derived from observations.
So instead of picking one Ye, we chose a combination.
Actinide Boost Stars
combination e
Instead of picking one very low Ye, we chose a combination that was motivated by literature and observations of the GW170817 kilonova.
This combination of Ye---in red here---does much better matching to actinide-boost abundances than any single Ye---in blue.
Can we make a more general argument? [NEXT]
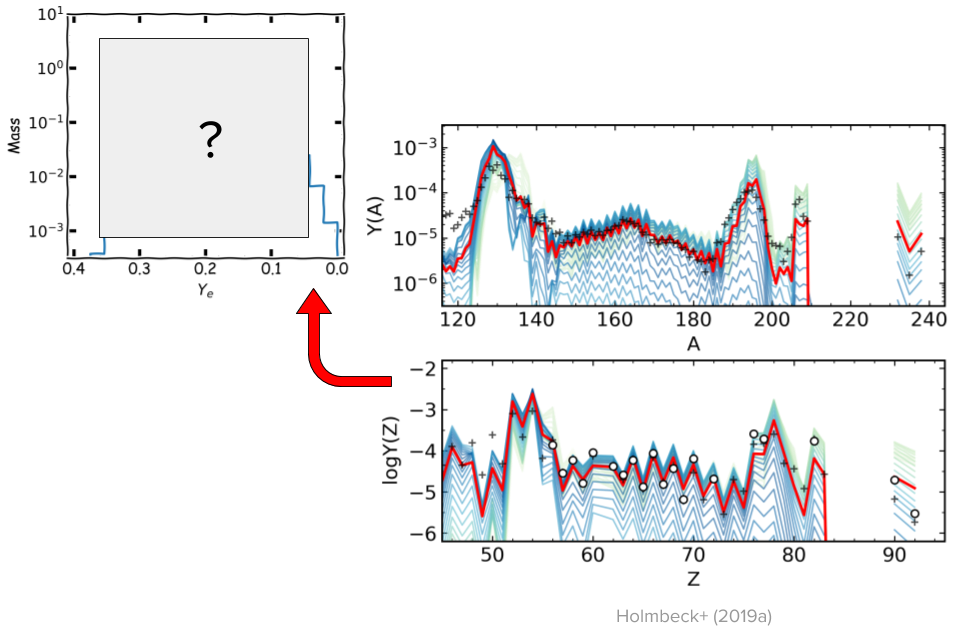
Going backwards
Can we instead go backwards and describe a Ye combination from the stellar abundances themselves...
And therefore build a distribution that characterizes the r-process event needed in order to reproduce those abundances.
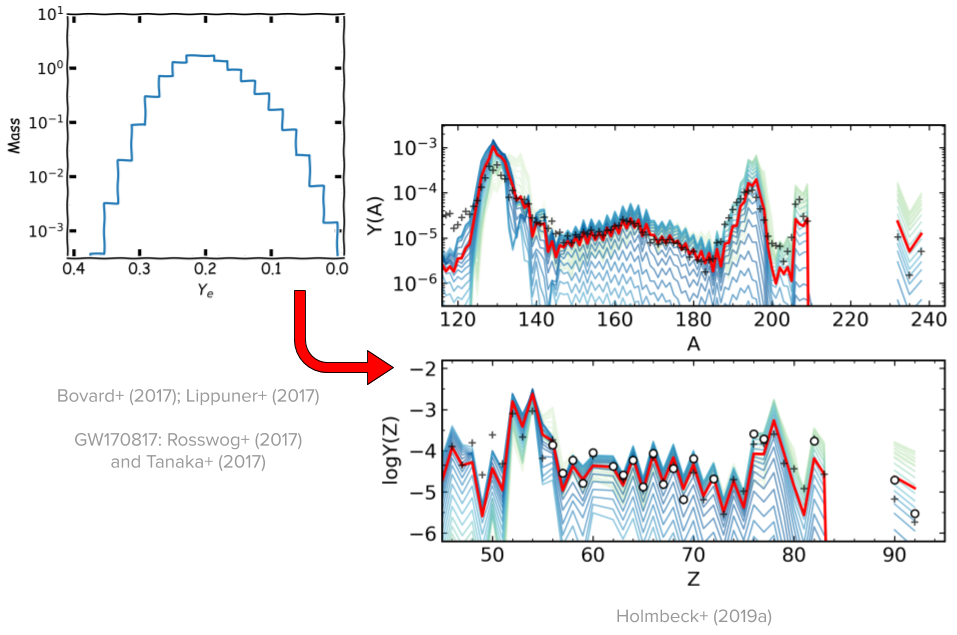
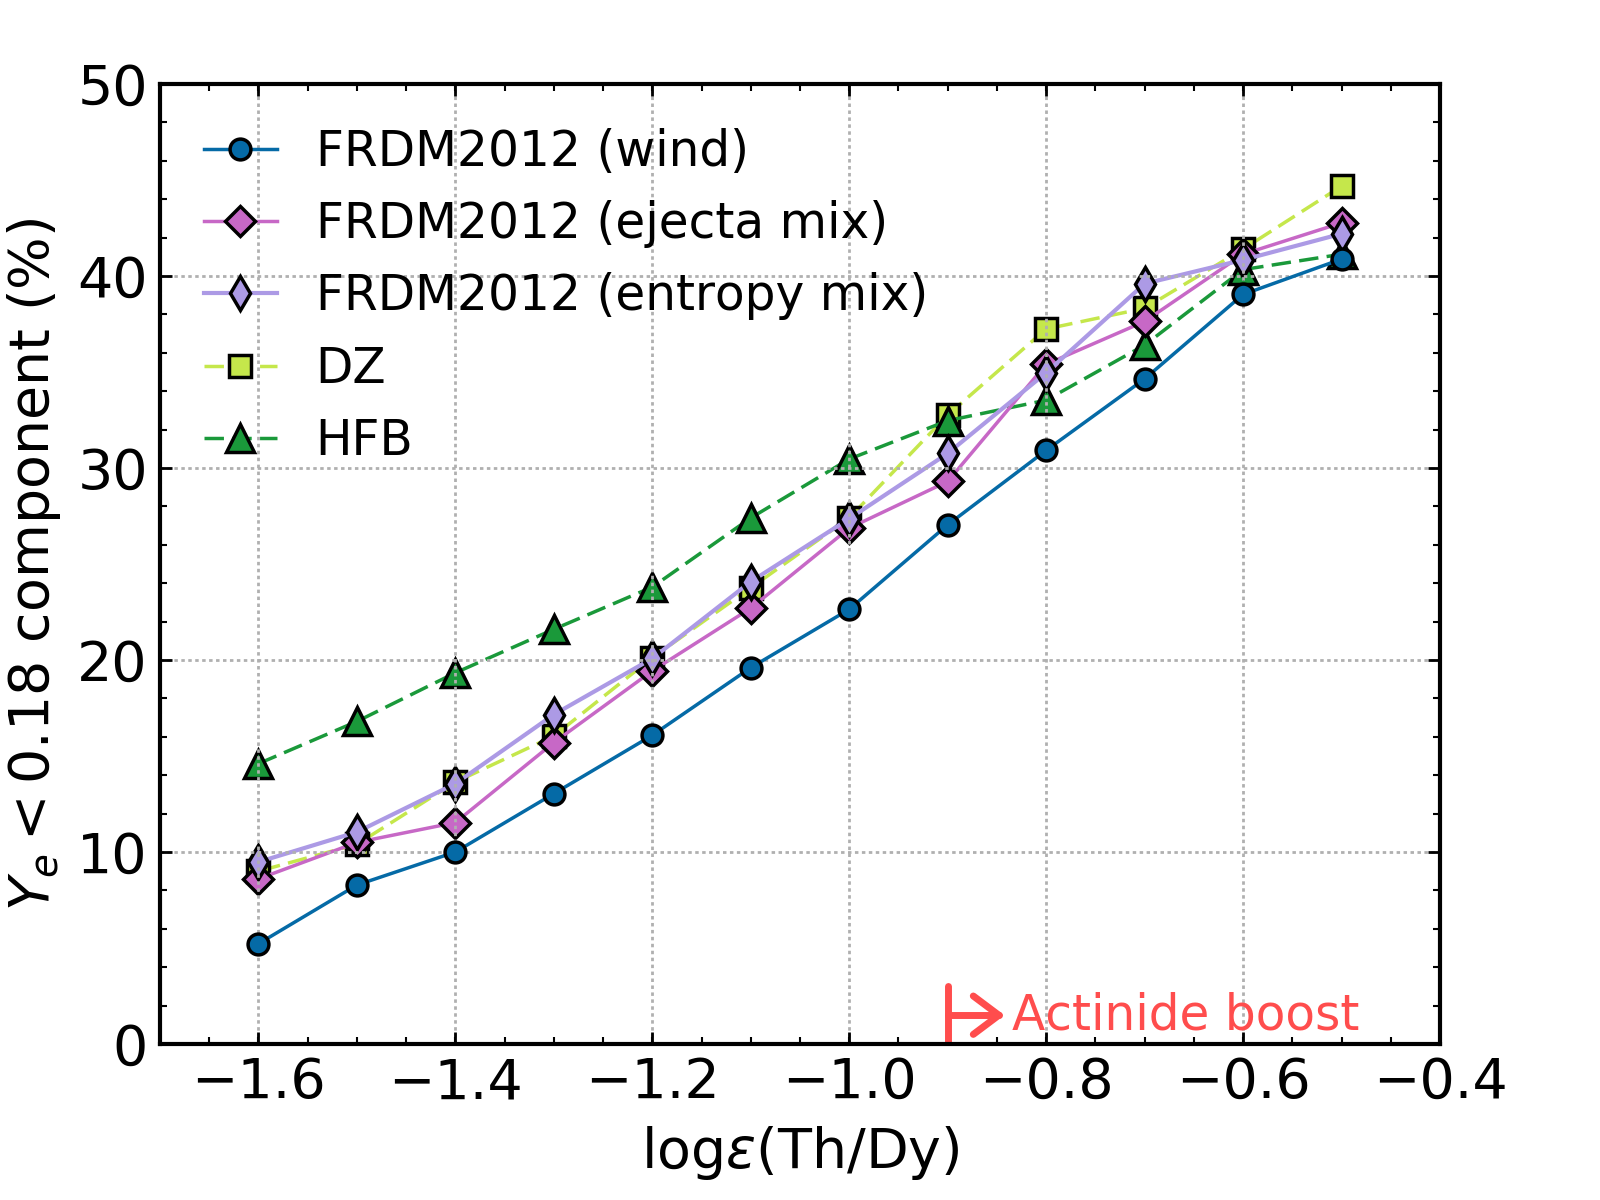
Actinide-Dilution with Matching Model
empirical e (0.005-0.450)
To explain entire pattern using Zr Dy Th only
So we built a model to do this that uses a Monte Carlo method.
First, we ran about one hundred r-process nucleosynthesis simulations using PRISM
starting at different Ye's, each of which produces a distinct final abundance pattern.
Then, we give the model constraints using three elements.
[PLAY]
The model randomly picks a number of initial Ye's, then adds together the final abundance patterns.
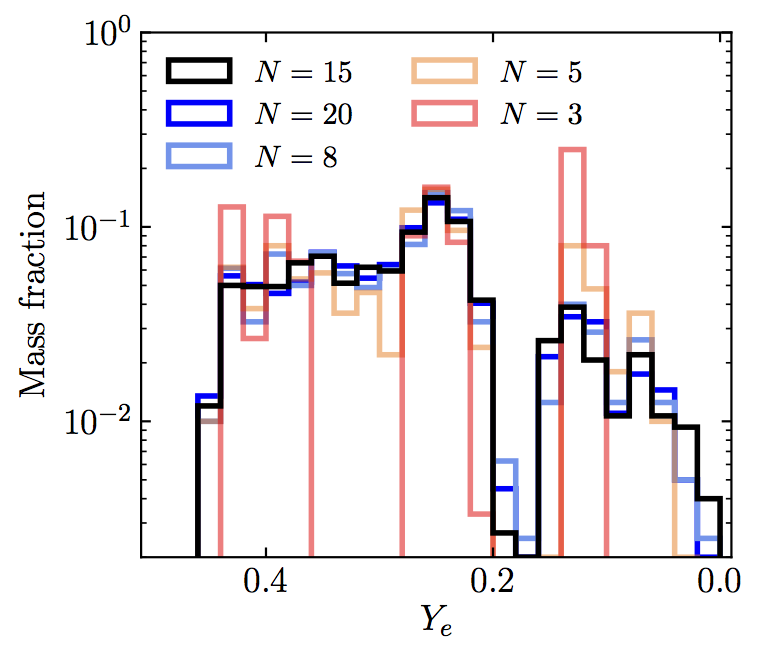
If the summed abundance pattern agrees with the input abundances, then we keep that randomly-chosen set of Ye's and add them to this distribution on the left.
This is the orange line in this movie. We run this hundred of thousands of times until this distribution converges.
In the end, this distribution shows how the ejecta of an r-process event could have been distributed in Ye
in order to produce the input stellar abundances on the right.
ADM
The low-Ye component
No discrete difference
Holmbeck+ (2019b)
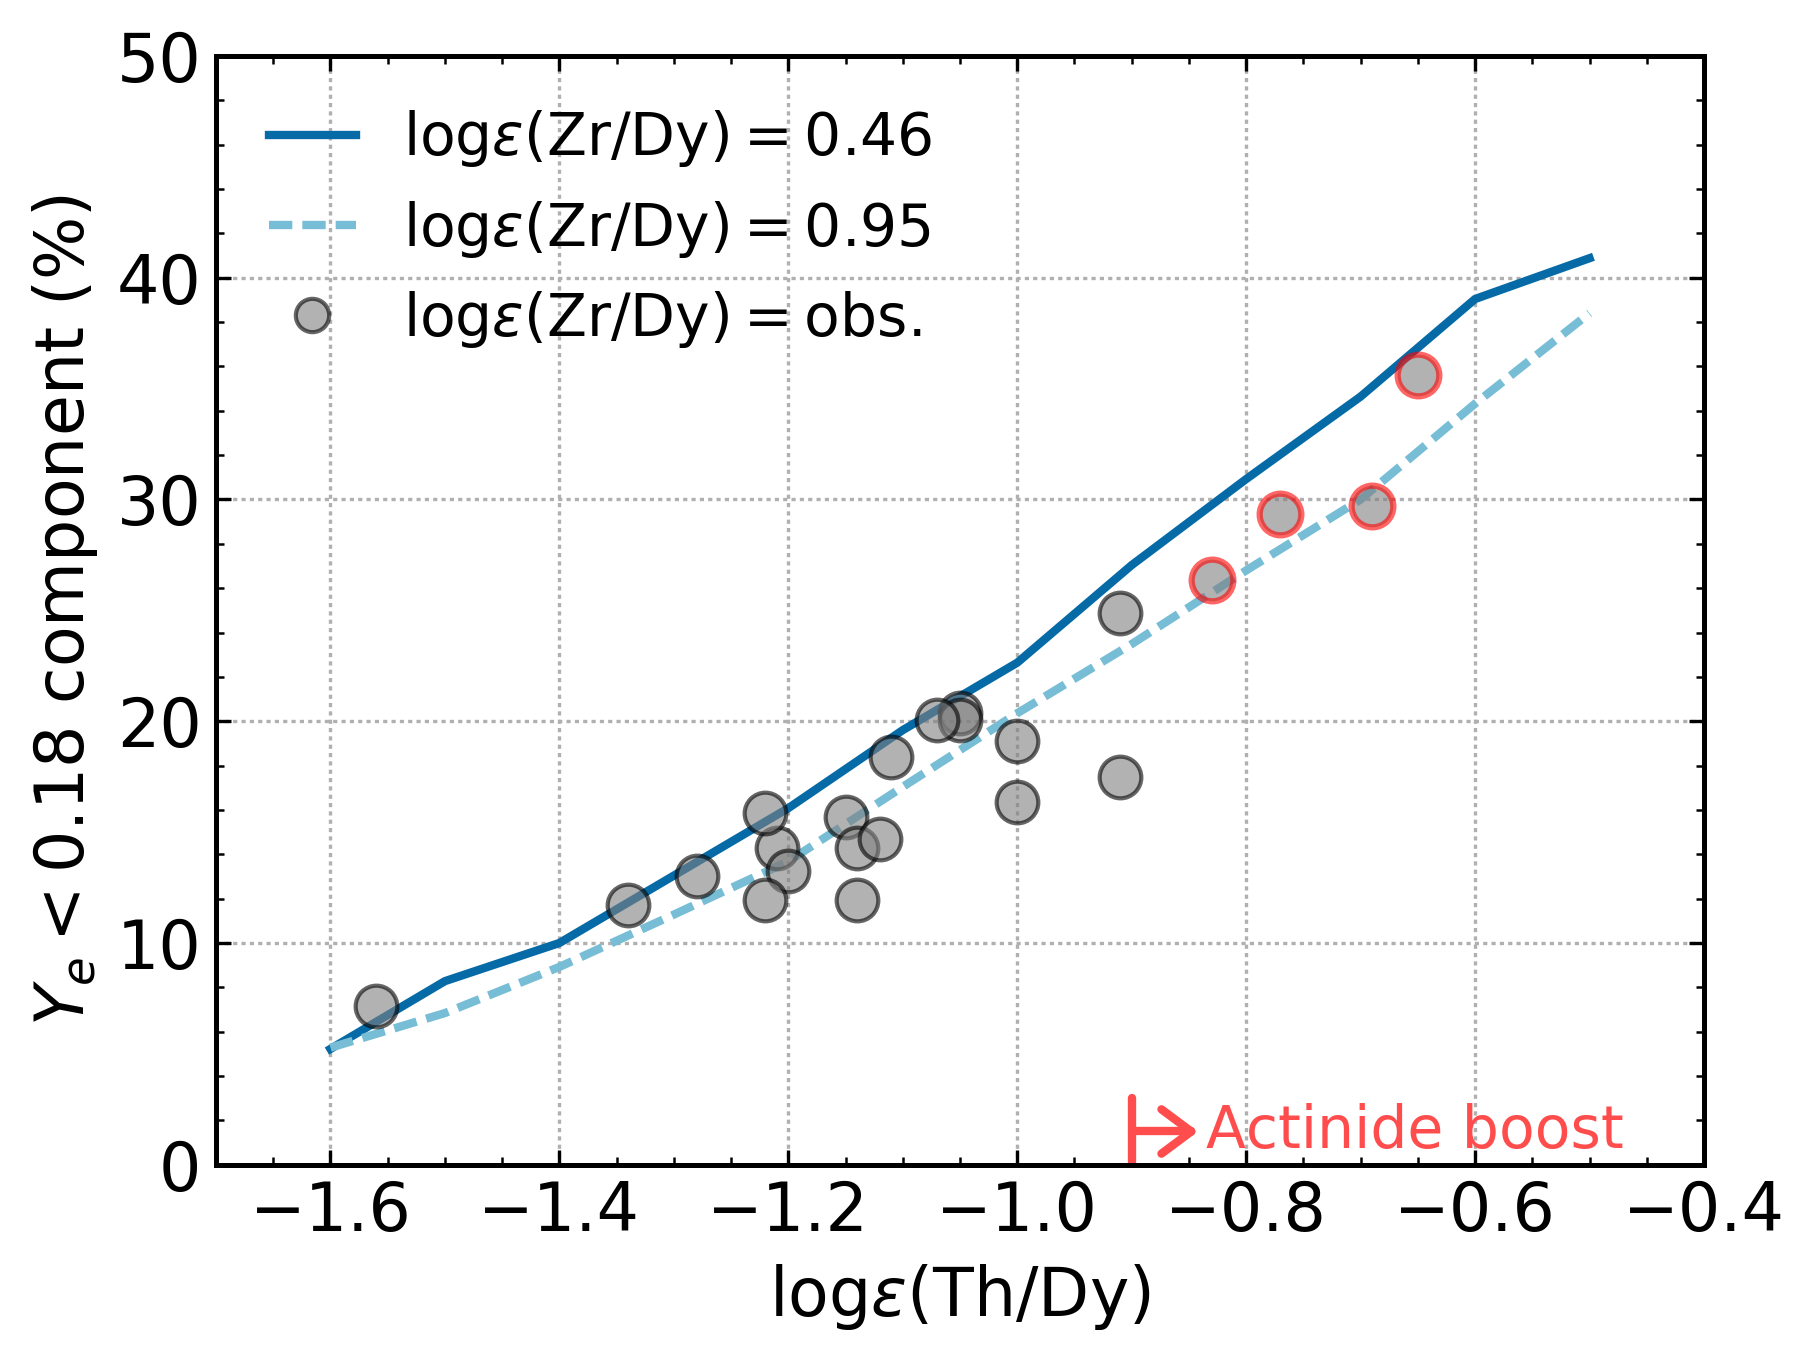
We can quantify the contribution from the very-low Ye component.
This plot is a little complicated. Basically, we ran a series of these simulations where we varied the required actinide contribution systematically,
and this axis shows what percentage of the total ejected mass is allowed to be in that low-Ye tail.
The gray dots show what the low-Ye contribution would be for individual stars after running this model.
Notice a few things. First---if you were to project this into a histogram---the actinide-boost stars are just at the tail of an otherwise normal/Gaussian distribution.
Secondly, the low-Ye contribution that we get from the ADM results varies smoothly from actinide-poor to actinide-boost.
So what does this imply?
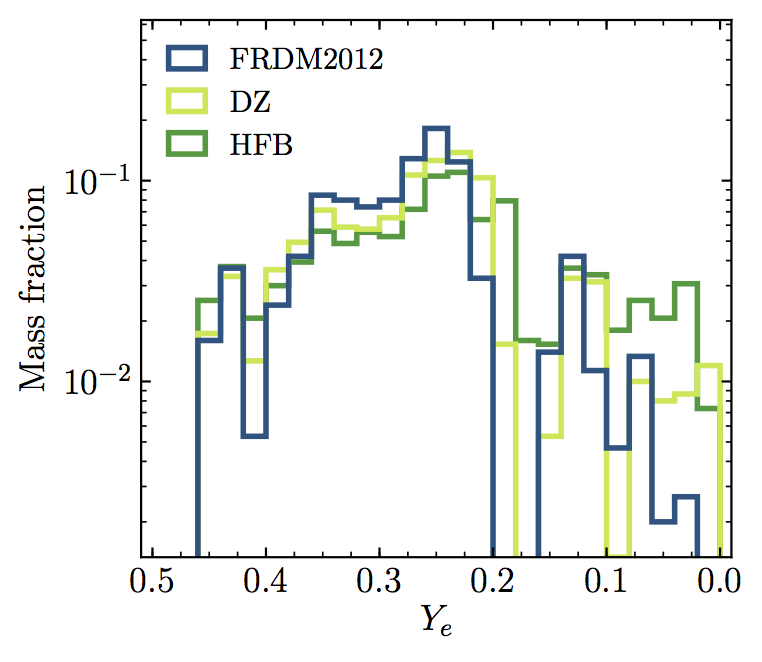
Nuclear and Astrophysical Variations
Holmbeck+ (2019b)
Actinide-boost stars do not necessarily callr -process progenitor
This could mean that stars showing the extra enhancement of actinides could be made by the same r-process site as the actinide-deficient case.
For example, this is accommodated in a NSM model by different amounts of dynamical ejecta where very robust actinide production may occur.
[NEXT] Well, we have observations of one NSM event, so we can compare our distribution to observations to test if they agree with a NSM.
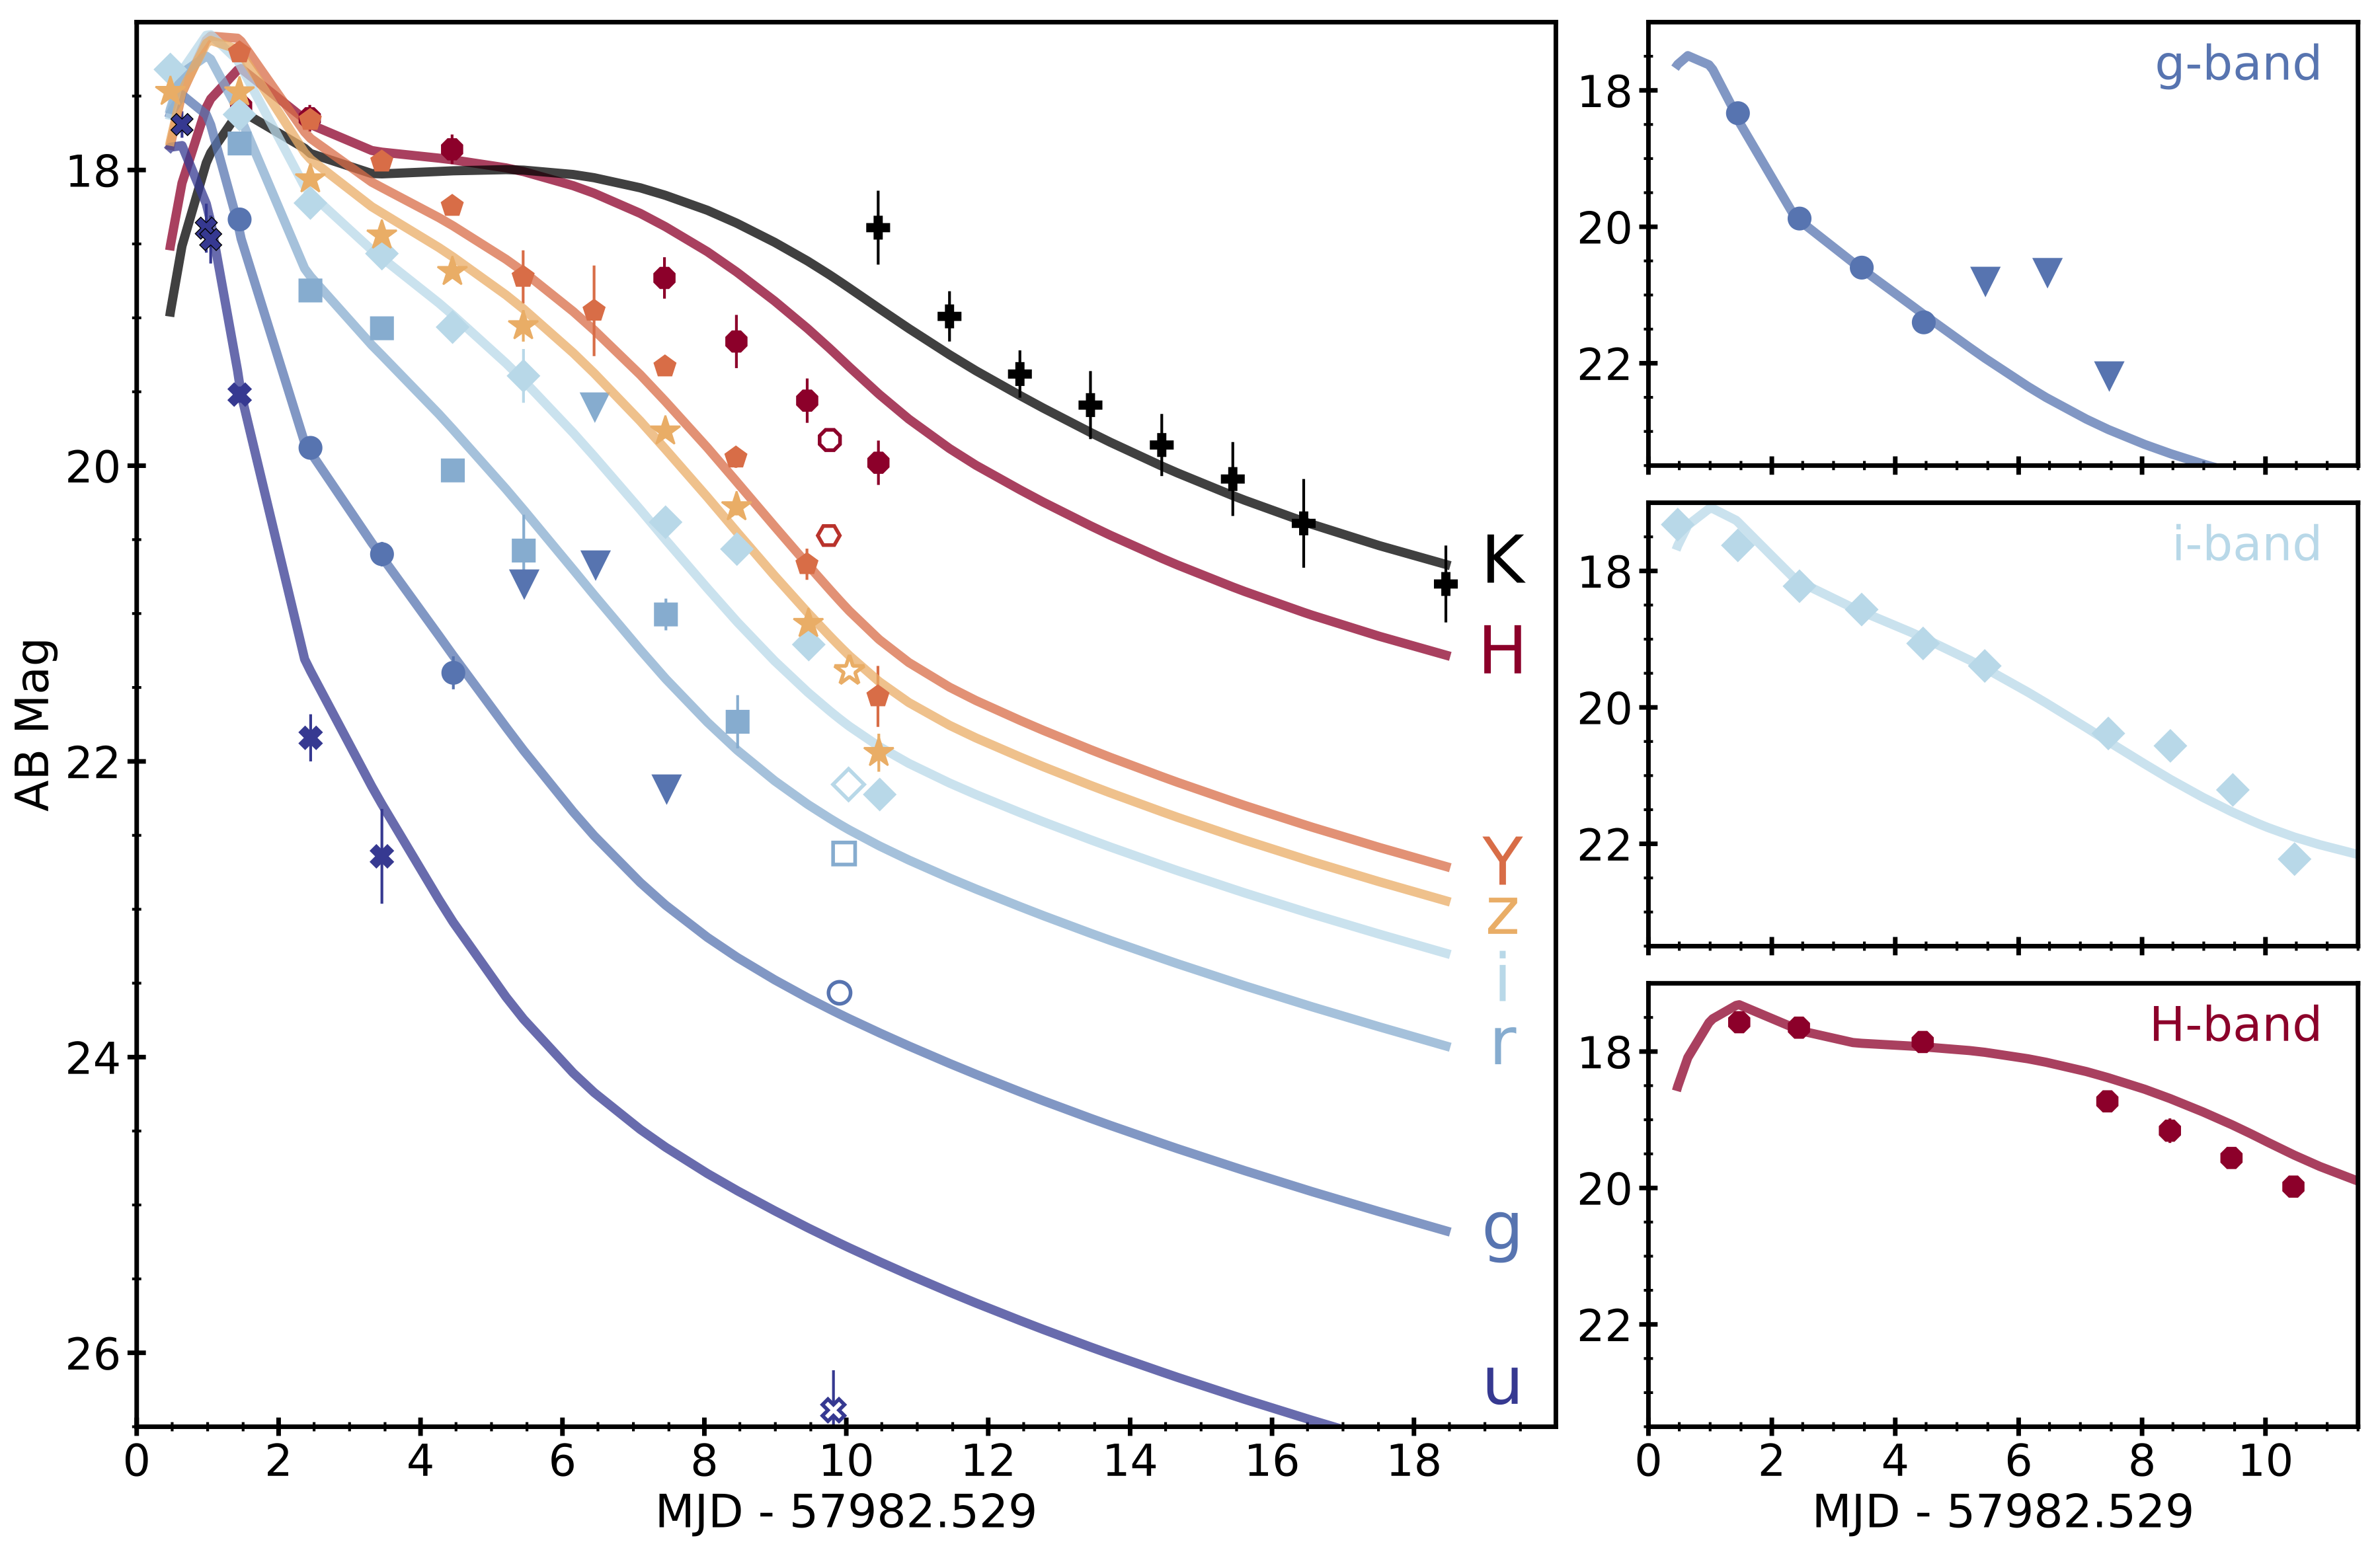
GW170817 lightcurve
blue ejecta + Lanthanide-rich red ejecta
Cowperthwaite+ (2017)
In addition to gravitational waves, GW170817 released electromagnetic radiation.
To explain the lightcurve from this event, many studies have argued that there must have been at least two components of the NSM ejecta:
a lanthanide-poor blue component, and a lanthanide-rich red component.
So we can do the same thing with our distribution to test if it matches with this observation.
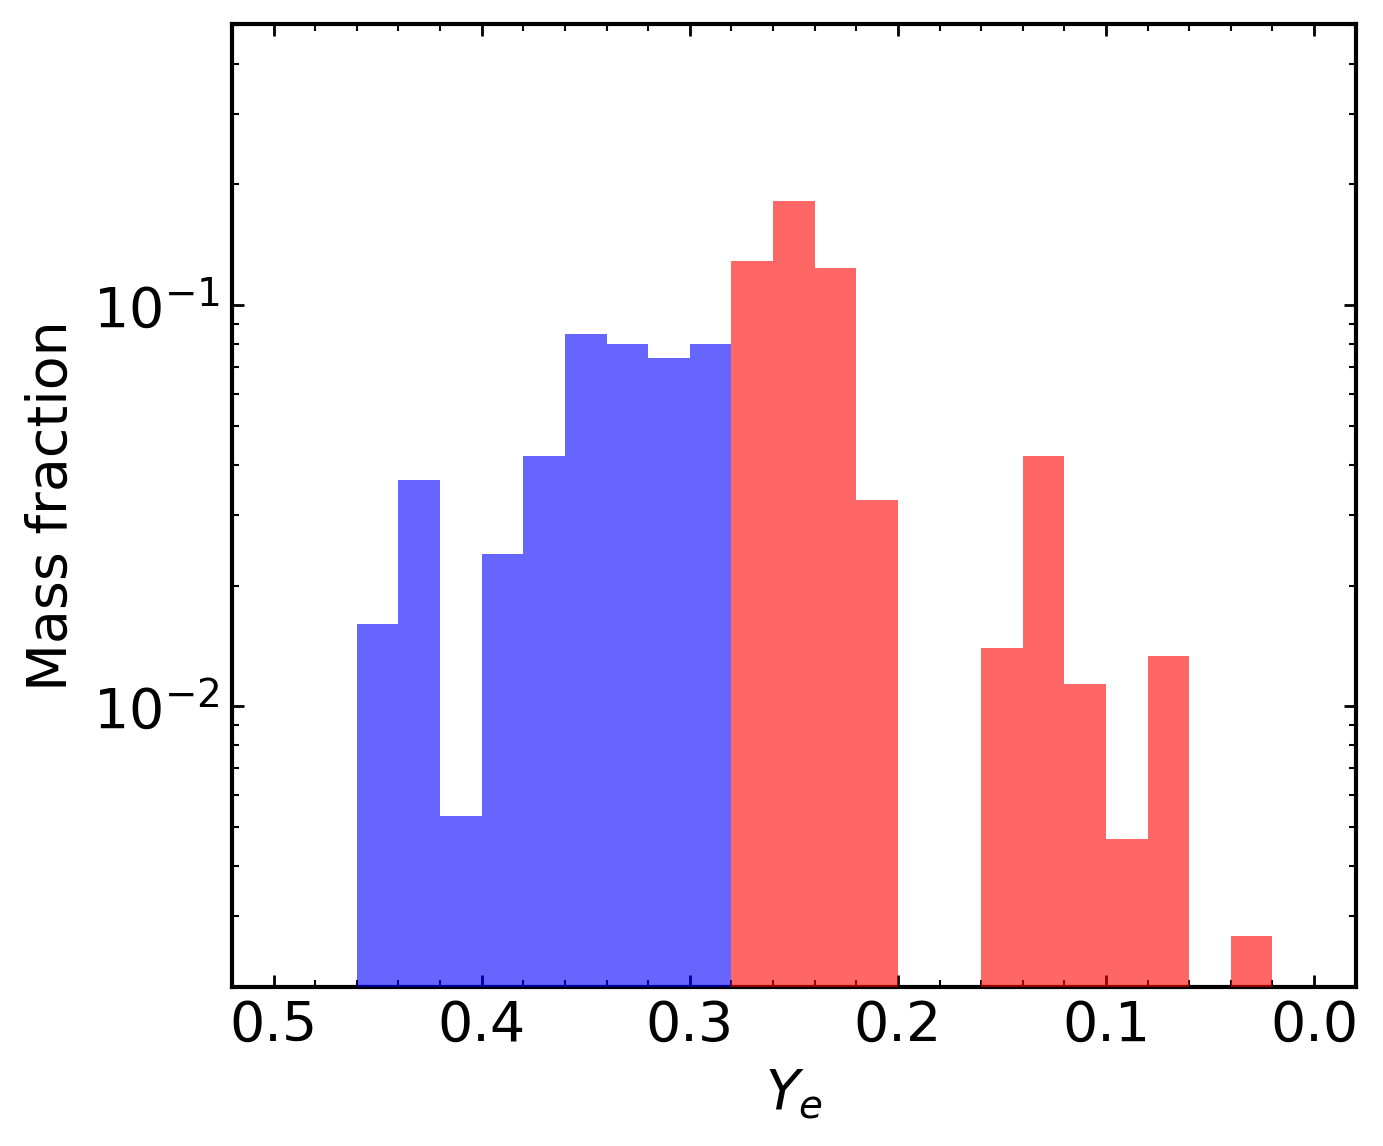
Two ejecta components
Stellar Abundances
X lan = 10-3.8 X lan = 10-0.8 m red / m blue = 1.7
GW170817
X lan = 10-4 X lan = 10-1.5 m red / m blue = 1.6
Inspired by this red and blue component model, we split our mass distributions into red and blue components,
and calculated the lanthanide mass fractions and the mass ratio between them.
And we get numbers.
We compare that to the same numbers from an independent study of GW170817.
It's amazing that they are so similar considering we built these distribution from spectroscopic observations of r-process enhanced stars,
and the numbers from the kilonova are from an entirely different kind of observation.
This is what we come up with just from stellar abundances---three elemental abundances in particular.
It's still possible that our results from the r-process enhanced stars could be from a different r-process site,
but these results are surprisingly similar considering our vastly different approaches.
Results derived from r -enhanced stars are
r -enhanced stars?
What we derived from observations of stars is similar to results derived from a NSM observation.
This could suggest that the r-process enhanced stars like Ret II were indeed enriched by a NSM event.
It does not need to be a NSM merger. For example, a collapsar could yield similar results.
Special Thanks
Timothy C. Beers (ND), Nicole Vassh (ND), Terese T. Hansen (TAMU), Chris Sneden (UT-Austin)